The Elliott wave theory, ( or some call it the Elliott Wave Principle) Elliott wave analysis and how to trade Elliott Waves can be a mind boggling trading concept to understand especially for a new forex trader.
You see, I consider myself pretty good when it comes to price action forex technical analysis but when it comes to Elliott waves, even the “old dog” gets lost sometimes…
Elliott Wave Theory and How to trade it, is without doubt one of the most difficult trading concepts to understand because you are now just focusing on one or two things but quite a handful of them.
[toc]
You talk about:
- corrective waves,
- motive waves,
- impulse waves,
- grand super cycles,
- supercycles,
- 5 wave pattern,
- 3 wave pattern and so forth.
- And then there’s the Elliott wave fractals…what’s that supposed to mean?
Can you see what I’m getting at?
And guess what? That is not the complete list!
Here’s what I mean by getting lost:

There are two things that make many forex traders stay away from trying to understand how to trade Elliott Waves:
- The Elliott Wave Theory itself is difficult to grasp at first.
- The application of the Elliott Wave theory in real time trading gets difficult because the charts look messy. Where do you being the wave count? Is this the 1st wave, the 2nd, the third. Is this the 5th wave?
Here’s the fact:
the basic Elliott wave theory itself can be understood if you spend a bit more time on it but the application part in real time trading is what gets most traders lost…and I mean SERIOUSLY lost in some cases.
Elliott wave trading is not that easy to understand…at first. As a matter of fact, the easiest part is the theory part.
The hardest part is the application part!
Frankly speaking, there’s too much work involved in Elliott wave analysis and who really has time for that?
Well, some do!
So, that’s why I have put his Elliott Wave Trading Course together to write it in a simple way to make newbie forex traders understand Elliott waves and Elliot wave theory better better.
And if that is the part you want to take, I hope that what you learn here will take you a long way…
Let’s get started!
Who Developed The Elliott Wave Theory?
There was a guy in the 1920’s/30’s who was called Ralph Nelson Elliott. That’s a photo of him down there. He was the guy who came up with this Elliott Wave Theory.

He analysed 75 years worth of stock data and stumbled upon a discovery about the behavior of the stock market.
This is the discovery: stock prices do not move chaotic manner but in repetitive cycles.
He published his theory in a book called The Wave Principle when he was about 66 years old.
According to Mr Elliott, these repetitive cycles of stock prices were the results of:
- investor emotions caused by outside influences or
- trading mass psychology at that time
Elliott explained that the downward and upward swings in stock market prices caused by the collective mass trading psychology always show up in the same repetitive patterns.
And he called these swings, waves.
And so Elliott explained that if you know the structure of these waves, then you can correctly predict where price will go next (or not go).
This is what really matters to traders=making the right prediction about where the price will go next or not go next.
Amidst Chaos There’s Order&Structure
The really cool thing about the with Elliott’s discovery was the fact that now traders would no longer look at market upswings and downswing as random or chaotic price movements but now they can find order and structure in those price movements.
Elliot named this discovery after himself, calling it the The Elliott Wave Theory.
So put simply, the Elliott wave theory helped traders find order and structure in a chaotic market!
Elliot Wave Analysis
This is the theory of Elliott Wave: Mr Elliot said that in a trending market, price moves in a 5-3 wave pattern.
And in this 5-3 wave pattern, there are two types of waves:
- the first wave pattern is called the impulse wave
- the second wave pattern is called the corrective wave.
So what are impulse waves? Impulse waves are waves that move in the direction of the main trend.
What are corrective waves? Corrective waves are waves the move in against the main trend.
Now, let me go through each of these waves…
The Basic 5 Elliott Wave Pattern
The chart below shows the structure of the 5 wave pattern or sequence. As you can see the trend is up.
Note that:
- waves 1, 3 and 5 are impulse waves
- waves 3 and 4 are corrective waves.
Remember this: impulse(or motive) waves go with the main trend and corrective waves go against the trend.
This is the most basic impulse advance 5-wave Elliott wave sequence.

Elliott Wave-Basic 3 Wave Correction
Now, what happens above after the 5 wave sequence above?
Well, price goes into what is called a corrective wave sequence…that sounds really fancy so let me make it easier for you to digest: after the 5 wave sequence, expect price to start developing a pattern to change the trend direction.
For example, if the trend was up then after the 5 wave sequence has developed fully then expect the market to start turning and head down, forming a downtrend!
So in addition to the 5 wave sequence, you now have 3 more waves, which is called the corrective wave pattern.
Now, these 3 additional waves are not numbered 6, 7 and 8. They are marked in letters, a, b & c waves as shown on the chart below:

Notice on the chart above the waves a & c are impulse waves and b is corrective wave.
Complete 8 Wave Cycle
Now, if you bring the basic 5 wave pattern and the 3 wave pattern together, you get a complete Elliott wave cycle that consists of 8 waves and looks like this in an uptrend market:

Ralph Elliott divided this complete wave cycle into two distinct parts, the impulse and corrective wave parts.
The impulse phase is represented by the 5 wave sequence and abc waves represented the correction of the main trend or the larger impulse phase.
Similarly, in a downtrend market, you will have something like this:

The 3 Golden Rules Of Elliott Wave Theory
Just like the Old Testament has 10 commandments and the 9th commandment, (“paraphrase”) goes like this: thou shall not covert your neighbor’s wife.
Well? Mr Elliott had 3 specific” commandments” about the Elliott Theory too but this had nothing to do with women:
- Wave 2 shall not retrace more than 100 % of wave 1
- Wave 3 shall never be the shortest of the 3 impulse waves
- Wave 4 can never overlap wave 1.
This chart below should make understanding of these 3 Elliott wave trading rules much clearer:

Further Explanation on these 3 rules:
- Rule 1 explained: wave 2 cannot go below the low of wave 1. If a break occurs below this low, you need to start your re-count.
- Rule 2 explained: wave 3 should be the longest of the 3 impulse waves but it cannot be the shortest which means that either 1 or 5 can be longer but BOTH CANNOT BE longer than wave 3. Also the high of wave 3 must be higher than that of wave 1 and it it is not high, you have to start your re-count. Impulse waves are meant to be making progress not slowing down. Therefore if price does not exceed the high of wave 2, then that means there’s no progress therefore you have to start the re-count.
- Rule 3 explained: wave 4 cannot overlap wave 1 which simply means that the LOW OF WAVE 4 cannot go BELOW THE HIGH OF WAVE 1. If that happens, you need a re-count.
Elliott Waves And Fractals
What are fractals? Fractals are structures that can be split into parts and the split parts will be a very similar copy of the whole part that they split from.
Nature has a lots of fractals, here are few examples:

Ok, so what does fractals have to do with Elliott waves then?
Well, a lot!
You see, Elliott waves are fractals.
Why?
Because Elliott waves can be be again subdivided into smaller Elliot waves.
Here’s what that means:

Here are example of Elliott Wave Fractals In a downtrend:

So basically, Elliott wave fractals are the smaller Elliott wave patterns within the bigger Elliott wave patterns.
Put simply, Elliott Wave fractals are “Elliott waves within Elliott waves”:

These Elliott wave fractals do create a one big problem for many forex traders on real live trading charts.
Here’s the problem: how can a trader tell the start of the bigger Elliott wave fractal…or is it the smaller wave fractal???
You see what I’m talking about here?
3 Elliott Wave Guidelines
So you think that all you need is the 3 Elliott Wave Theory Golden rules and you’d be done with, right?
Not yet…
You see, you got 3 golden rules and then you also have 3 Elliott Wave guidelines…
So what are these 3 Elliott wave theory guidelines?
- when the wave 3 is the longer impulse wave, wave 5 will be almost/approximately equal to wave 1
- the forms for wave 2 and wave 4 will alternate…if wave 2 is a sharp correction, wave 4 will be a flat correction. If wave 2 is flat, wave 4 will be sharp.
- after a 5 wave impulse advance, corrections abc usually end in the area of prior wave 4 low.

Why 3 Elliott Wave Guidelines Are Important?
If you are wondering why the 3 Elliott wave guidelines are important then here are the reasons why:
First Guideline
- useful for targeting the end of Wave 5.
- Even though Wave 5 could be longer than Wave 3 and Wave 3 could still be longer than Wave 1, chartists can make initial Wave 5 projections once Wave 4 ends.
- In a larger uptrend, chartists simply apply the length of Wave 1 (percentage change) to the low of Wave 4 for an upside target.
- The opposite is true for a 5-wave decline.
- The percentage decline in Wave 1 would be applied to the high of Wave 4 for a Wave 5 estimate.
Second Guideline
- is useful for determining the time of correction for Wave 4.
- After a sharp decline for Wave 2, chartists can expect a relatively flat correction for Wave 4.
- If Wave 2 is relatively flat, then chartists can expect a relatively sharp Wave 4.
- In practice, Wave 2 tends to be a rather sharp wave that retraces a large portion of Wave 1.
- Wave 4 comes after an extended Wave 3.
- This Wave 4 marks more of a consolidation that lays the groundwork for a Wave 5 trend resumption.
Third Guideline
- useful for estimating the end of a Wave II correction after a Wave I advance.
- Waves I and II are the larger degree waves. Waves 1-2-3-4-5 are lesser degree waves within Wave I.
- Once the Wave II correction unfolds, chartists can estimate its end by looking at the end of the prior wave 4 (lesser degree wave 4).
- In a larger degree uptrend, Wave II would be expected to bottom near the low of lesser degree Wave 4.
- In a larger degree downtrend, Wave II would be expected to peak near the high of lesser degree Wave 4.
How To Trade Forex Using Elliott Waves
You’ve learn the theory part…good.
Now lets get to what you are really here for: how to actually apply the Elliott wave theory to real live trading.
All of the Elliott wave charts you you have seen above are all “perfect”.
Well, I got bad news for you…the real live trading forex charts are not like that at all. They are messy and there are so much “noise” in them.
You really have to spend a lot more time on this to master Elliott Wave Trading.
In this section, I will show you some examples of real charts based on live market conditions and show you techniques on how to trade Elliot Wave patterns.
The Best Elliott Waves To Enter A Trade
The two best Elliott waves to enter trades on are the corrective waves 2 and 4 as shown on the chart below.

To make it simple, forget about all the waves that happen after wave 5.
It tends to really get confusing past that.
If you get into a trade and based on your count you see that you are riding the 5th wave, it would be the ideal time to:
- start taking some profits off the table
- and start trailing stop your trade to lock in your remaining profits because the trend may just be about ending soon.
2 Things Necessary For Trading Elliott Waves
The two things necessary for trading Elliott Waves are:
- the 3 Elliot Wave Rules
- and Fibonacci Retracements and Extensions
Now we are getting somewhere, aren’t we?
Steps To Trading Elliott Waves
Step 1: Identify Trend Start/End
Step 1 is to Identify if the trend has ended/new trend has started
To do this, you need to know and understand the structure of a trend and based on this you can identify if a trend has ended/a new trend is starting:
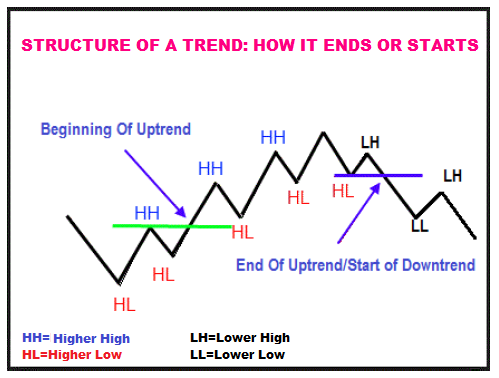
Based on the chart above:
- If market is in an uptrend, price will intersect the Higher Higher and continue going up.
- In a downtrend, price will make a Lower High instead of a Higher High and then intersect the Higher Low and continue to head down.
It looks and sounds complicated but really it is very simple…it is all about support levels being broken and resistance levels being broken causing downtrends and uptrends respectively.
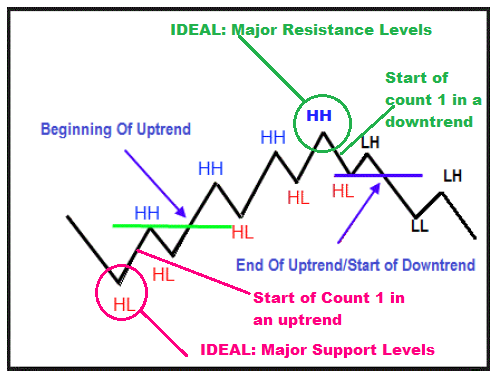
What are the Ideal Locations Where Trend Changes Occur?
One of the best places where trend changes occur are on support and resistance levels. If you can identify them and wait for price to hit them and then start your first count 1 as price starts moving up or down.
The chart below shows what I’m talking about:
Others can include:
- diagonal price channels
- trendline bounces and trendline breaks
- support turned resistance, resistance turned support levels
- Fibonacci extensions and retracements levels
Just think outside the box for a little on how you can use these with the Elliot Wave Counts
Step 2: Start Count 1
Step 2 is to Start Your Wave Count 1.
Your first wave count is the important one because that’s where everything starts off from.
The first wave as mentioned can happen because of the things mentioned in step 1:
- resistance and support levels
- trendlines
- price channels etc
Can you trade wave 1?
Not really.
But you can trade wave 1 move using methods like trendline trading strategy which allows you to ride that first wave 1.
So when the correction wave 2 starts to form, that’s when you’d be looking to add another position onto this trend. That’s applying the pyramid trading technique.
Step 3: Start Count Wave To & Prepare To Trade
Step 3 is to Start your wave 2 Count and prepare to take your first trade based on Elliott Wave Theory!
Now you see that wave 1 is finished and looks like wave 2 is forming.
Sit up straight now because this is where you will be entering your first trade based on the Elliott Wave!
The secret?
Watch your fibonacci retracement levels like 50% and 61.8% levels. That’s where you buy or sell.

In addition to that, you need to know your reversal candlestick patterns that will confirm your trade setup on these fib levels.
Here are the Bullish Reversal Candlestick Patterns you should be looking out for when wave 2 is forming and hits those Fibonacci retracement levels:
Similarly, there are the Bearish Reversal Candlestick Patterns you should also be watching out for in a downtrend when wave 2 is forming:

These bullish and bearish reversal candlesticks above do really help so you need to remember them.
Step 4: Start Wave Count 3 And Watch Your Profits Increase!
Step 4 is when wave 3 starts.
You do nothing here except ride out wave 3 and Watch Your Trading Profits Increase!
By now, you know that wave 3 is supposed to be the longest of the 5 waves.
If your prediction is right, wave 3 where you make the most money (profits):

Step 5: Start wave count 4 and Prepare to Trade
Step 5 is to start your wave count 4 so that you can take a trade just as wave 4 is ending so that you can ride out wave 5.
Assuming all is going out as predicted, this is where you will enter your 2nd trade based on the Elliott wave theory.
Similar to step 3, use:
- fibonacci retracement levels, 38.2, 50% 0r 61.8 to identify potential turning points
- and also use reversal candlestick for trade entry confirmation
- you can also use or combine trendline trading strategy to enter here as well if price comes and hits the trendline as shown on this soybean futures chart below:

Step 6: Wave 5 Count: Start Taking Profits Off the Table
You know that based on the Elliott Wave Theory, the market starts to loose its steam once wave 5 goes past the high of wave 3.
The trend has a good chance of changing.
So what do you think you should be doing?
- I’d be taking profits off the table, maybe closing most of my trading positions and and leave a few running
- those few trader running, I’d be using this trailing stop loss technique to lock in my profits until the market takes me out.

What about trading the abc waves?
Forget it.
I’f you’ve made most of you money from wave 3 and then a little bit from wave 5, forget about trading the abc waves.
Wait for a new trend to form and repeat the process.
5-3 (8) Pattern Elliott Waves Happen In Every Trend?
No.
Sometimes, your wave count may terminate on wave 3, or 4.
Remember the 3 Elliott Wave Theory Rules?:
- Wave 2 shall not retrace more than 100 % of wave 1
- Wave 3 shall never be the shortest of the 3 impulse waves
- Wave 4 can never overlap wave 1.
If you start counting and if these waves mentioned above fail to satisfy the rules, that waves becomes null and void which means you have to start your counting again.
Summary
- Elliot Wave Theory is a complex theory.
- What I’ve covered here is not all that is to know about it…this is just the very basic. There’s a lot more to Elliott Wave Trading Than this.
- Elliott Wave Theory is simply support and resistance trading explained differently.
- All the complexities of Elliott Wave Theory when you strip it all away comes down to support and resistance trading…that’s it! No more no less.
- You don’t really need to over complicate it when you think in terms of support and resistance levels being broken and price rising or falling below them.
- The use of fibonacci retracements levels as well as extension do help in Elliott Wave trading as well as the use of bullish and bearish reversal candlestick patterns.
I hope I’ve made Elliott Wave Theory and Trading much simpler and easier for you to understand than many other trading websites.
If you think so, why not share your appreciation by clicking those sharing buttons below and share it? I’d really be thankful if you did that.
You are a great teacher. Taking a complex subject and simplifying it .Kind regards.
excellant work sir ,,,,,great …