In this post, I will show you how to draw trend lines the right way in 2 simple steps. Knowing how to draw trend lines is one important skill you need to learn as a forex trader because trendlines are important for identifying support and resistance levels.
What Is A Trend Line?
A trend line is simply a line that many forex traders use as part of their technical analysis. It is a line drawn along a trend to show support or resistance.
Here are the main characteristics of a trend line:
- A trend line can never be a horizontal line, it must be always be diagonal line.
- there are only two types of trend lines, a falling trend line and a rising trend line.
- a falling trend line shows that the market is in a down trend and a break of it can mean that the market is now in changing to an up trend.
- a rising trend line shows that the market is in an up trend and if price breaks it, it can mean that the market is now in down trend.
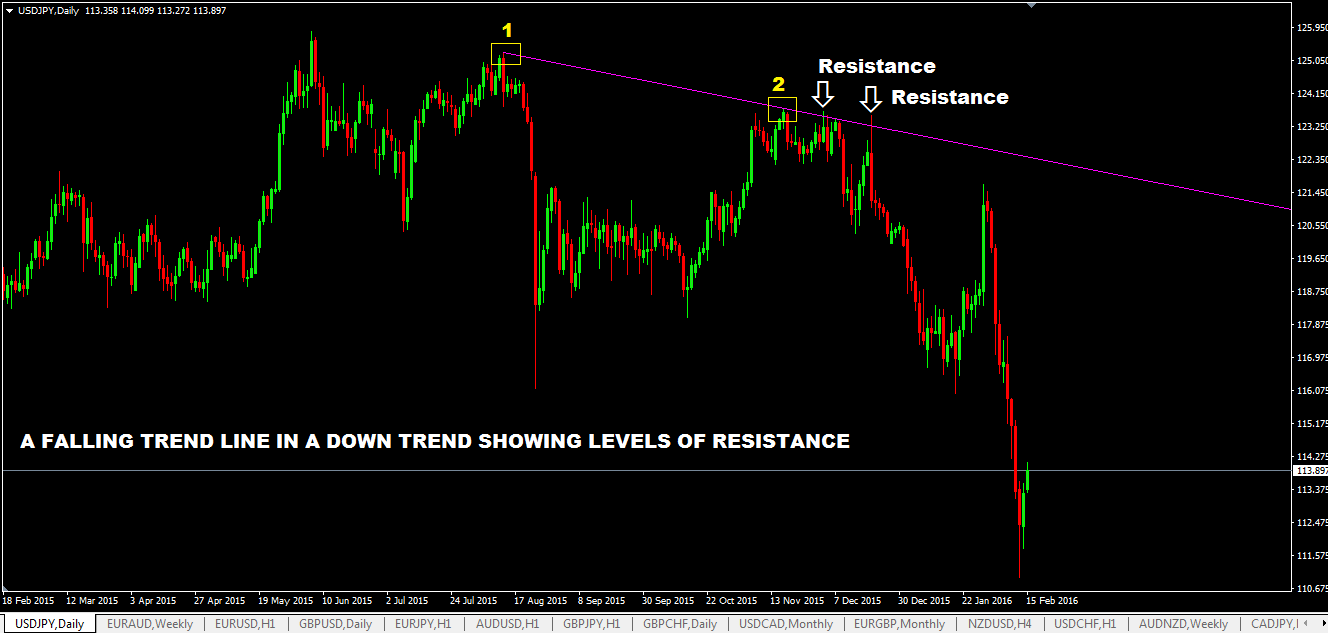
How To Draw A Falling Trend Line in A Down Trend
A falling trend line shows you that the market is in a down trend. A falling trend line is drawn above price.
If price heads up to the falling trend line, that line can act as zone or level of resistance for price and you can see price hit that falling trend line and move back down.
Here are the steps to draw a falling trend line in a down trend:
Step 1: Find two swing highs (peaks), these are shown as point 1 and 2 on the chart below.
Step 2: Connect point 1 and point 2 with a line
That’s it…you have a falling trend line!
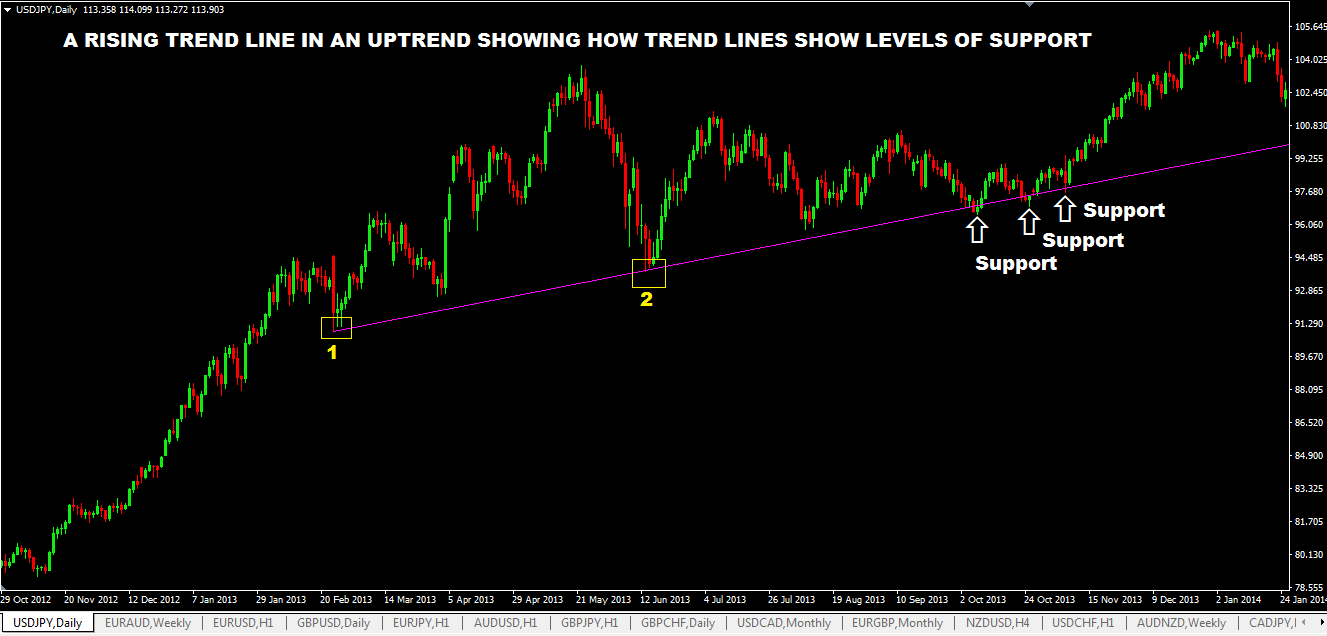
How To Draw A Rising Trend Line In An Up Trend
A rising trend line shows you that the market is in an up trend. A rising trend line is drawn below price.
If price heads down to the rising line, that line can act as zone or level of support for price and you can see price hit it and move back up.
Here are the steps to draw a rising trend line in an up trend:
Step 1: Find two swing lows (bottoms), these are shown as point 1 and 2 on the chart below.
Step 2: Connect point 1 and point 2 with a line
That’s it…you have a rising trend line!
4 Important Tips For Drawing Trend Lines
Here are some tips for drawing effective trend lines:
- larger time frames like the 4hr, daily, weekly and monthly charts produce the most reliable trend lines.
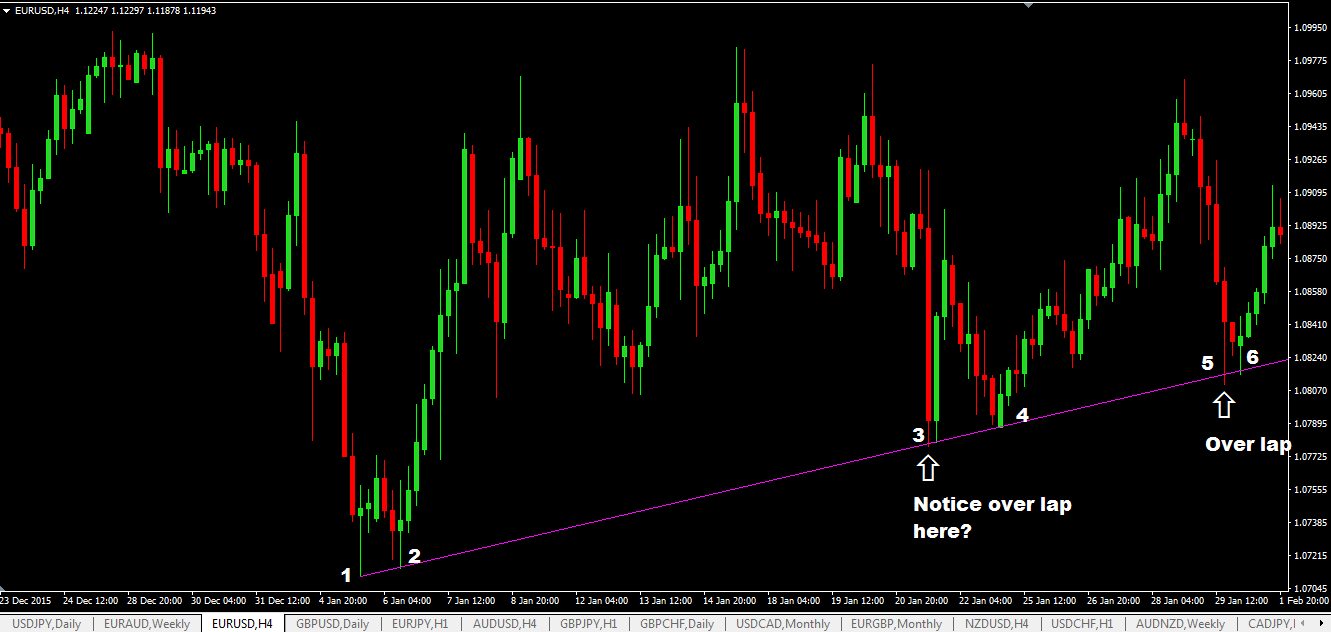
- there will be situations when you draw a trend line and you will see that the candlesticks will overlap the trend lines a bit with the high or low of the candlesticks but you should never draw a trend line cutting through the body of a candlestick. That is not the right practice.
- Do not force a trend line to fit on your chart. If it doesn’t fit, don’t bother drawing it.
- Point 1 and 2 that are used to draw trend lines must be reasonable spaced apart and are obvious to every trader. I don’t like drawing trend lines from points 1 and 2 that are very close together. There will be exceptions where I can do that hopefully that would be the subject of another post. Or if you wan’t to know, make a comment below and ask me how…
Examples of Trend Lines That Over Lap
Let me show you what trend line over lap means. See chart example below:
Here’s another one:

What Happens If Trend Lines Get Intersected?
If a trend line gets intersected, it can mean 2 things:
- the trend has now changed
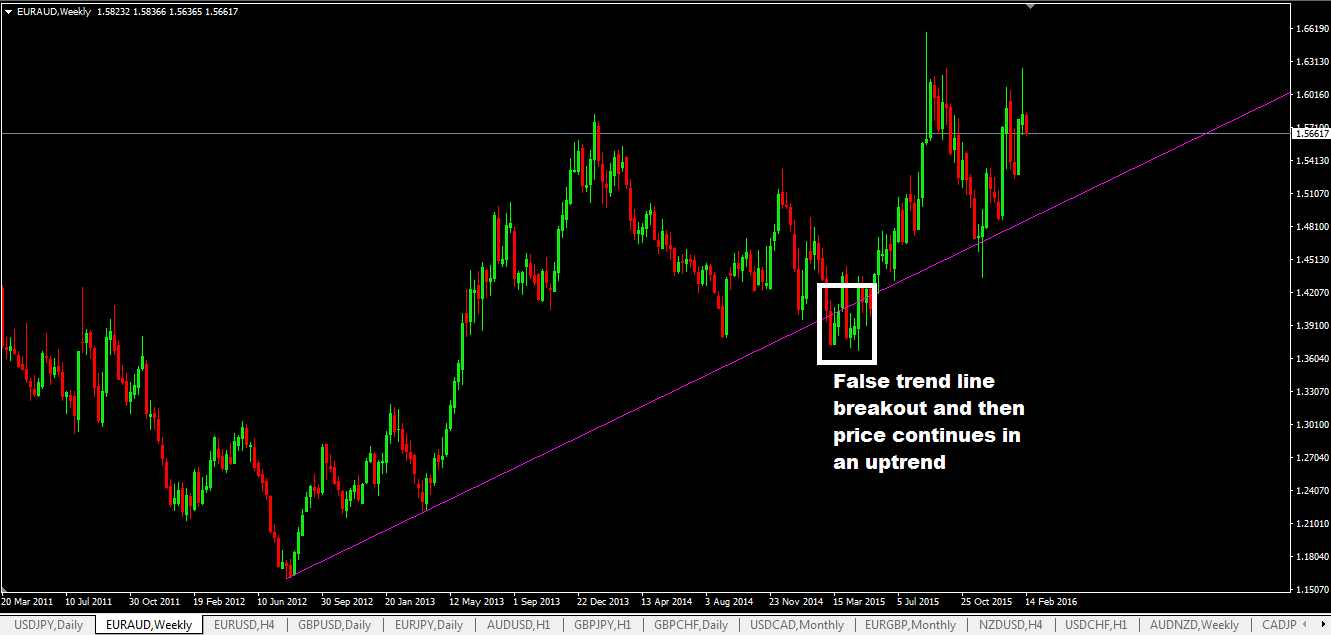
- it can be a false trendline breakout, the price will continue moving up in the original trend.
Here’s an example of a falling trend line break on the EURUSD pair. After the breakout, the trend changed to an up trend:

Here’s an example of a false trend line breakout:
How To Trade Trend Lines
There’s are two main ways to trade trend lines:
- you trade the bounce of the trend line and the trend line trading system shows you how.
- or you trade the breakout of the trend line and the trend line breakout trading system shows you how.
For trading the bounce of trend line, you simply wait for price to come back to the trend line at point 3, 4, 5 etc and you simply buy or sell depending on which trend line you use.
For a breakout trade on a trend line, you simply wait for price to break the trendline before you take a trade based in the direction of the breakout.
Summary
- if horizontal lines show horizontal support and resistance levels then trend lines show diagonal support and resistance levels.
- trend lines can help you pick great selling and buying opportunities and some times, you will be able to sell at the exact top and buy at the exact bottom. Only trend lines can help you do that.
- trend lines in larger time frames have more significance than the ones drawn on smaller time frames.
- if price breaks a trend line, it can mean 2 things: trend has now changed or it is a false breakout.
Enjoyed this? Then please share, like or tweet.