Support and resistance is one of the oldest technical analysis methods that traders use whether as a Forex trader, Futures trader, or any other market.
Whether a horizontal support and resistance indicator is used or they are manually plotted, they are often pivot points in the market and traders should be aware of them.
Moving Averages and Dynamic Support and Resistance
Traders will use a moving average indicator as part of a trading strategy and believe they offer support and resistance levels that are dynamic. The truth is that moving averages do not support the price level.

Since moving averages are derivatives of price as most indicators are, they lag price. When you think that a moving average is acting as a support and resistance indicator what you are really seeing is the moving average catching up to price.
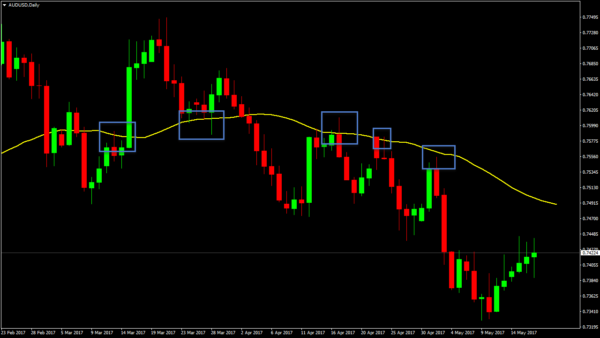
As price starts to consolidate or pull back, the moving average calculation continues and is using slowing price movement. It only makes sense that the average will catch up to price and give the appearance that the moving average indicator was a support level in an uptrend or resistance level in a downtrend.
Looking at the chart, you can see that price seemingly bounces from the moving average acting as support and resistance.
Look left!
Can you see how price is actually reacting to price structure? Keep that in mind when you think that averages are magical barriers to price.
Using Price High and Low for Support and Resistance
It is fairly straight forward when plotting horizontal support and resistance level lines. Most traders will use turning points in the market which are easily visible on any chart. While not an exact science, this is an easy way to gain some perspective of your chosen market.
Since many traders scan many instruments, the use of a support and resistance indicator can speed up the process during your scan. The Forex market has so many currency pairs you can trade that it can be extremely time consuming manually plotting these lines.
It gets even worse when using trend lines. Deciding on which peak or trough to use to connect the lines just slows down the process even more.
Support and Resistance Indicator You Can Download
If you use MT4 (Metatrader) there are a lot of support and resistance indicators you can download. If pivot point trading is part of your strategy, there are even more of those available.
Keep in mind that pivot points are another mathematical calculation. While some traders will say that institutions use them, there is no proof to the claim.
Also know that support once broken can act as resistance when price comes up from underneath. The opposite is true for resistance.

I have applied the S/R indicator (you can download the indicator at the end of this post) to this daily Forex chart. While you can use any time frame, higher time frames usually have stronger levels. Using a “top down approach” is good trading business. I also prefer to use support and resistance with swing trading strategies or position trades.
- Blue dots are support levels that could act as resistance if broken
- Red dots are resistance levels that could act as support if broken
The blue numbers are on top of the price and the arrows show the support and resistance zone that price went back into. Depending on your trading strategy, these all may be trades you could take.
- Price broke support and rallied up to previous support which can now be traded as resistance
- Price took out many resistance levels on the way up but got stopped at a major support level
- Price rallied up into former support
- Lower highs and higher lows equals congestion as shown by the white lines. Price will break and the trade is the retest
- Price has rallied up into previous support and has held as resistance for 3 days
Pretty clear cut. You just need a trading strategy and entry trigger to take full advantage of the indicator plots.
Here is a price action trading strategy use can use for trading support and resistance levels
Profit Targets and Stop Loss Using Support and Resistance Indicator
You could also target previous support and resistance levels for price targets. Trailing your stops behind each plot is also a viable way to make money trading.
Your stop loss can go above the previous resistance plots and below previous support plots.
Support and resistance is a pure price structure way of trading. While technical analysis such as support and resistance relies on past price, its based on pure price and not a mathematical calculation.