When it comes to trading Forex, identifying support and resistance levels can be a game-changer for your strategy. These price points often act as barriers, influencing market trends and potential reversals.
But how can you effectively spot these levels in the ever-fluctuating currency markets?
Let’s explore three essential tips that will sharpen your ability to recognize support and resistance, helping you make better decisions and potentially improve your trading outcomes.
Analyze Historical Price Action
When analyzing historical price action in forex, you’ll need to examine past price movements to identify potential support and resistance levels.
Start by looking at charts over different timeframes, from daily to monthly, to spot recurring price zones where the currency pair has struggled to move beyond. These areas often indicate strong support or resistance.
Pay attention to historical trends and how they’ve shaped the current market condition. You’ll notice that some price levels have repeatedly acted as turning points, where the currency pair has bounced off or reversed direction.
These are key areas to mark on your charts.
Don’t just focus on exact price points; instead, consider price zones. Markets aren’t always precise, and support and resistance often work as areas rather than specific numbers.
Look for clusters of highs or lows that form these zones.
Use Multiple Timeframes
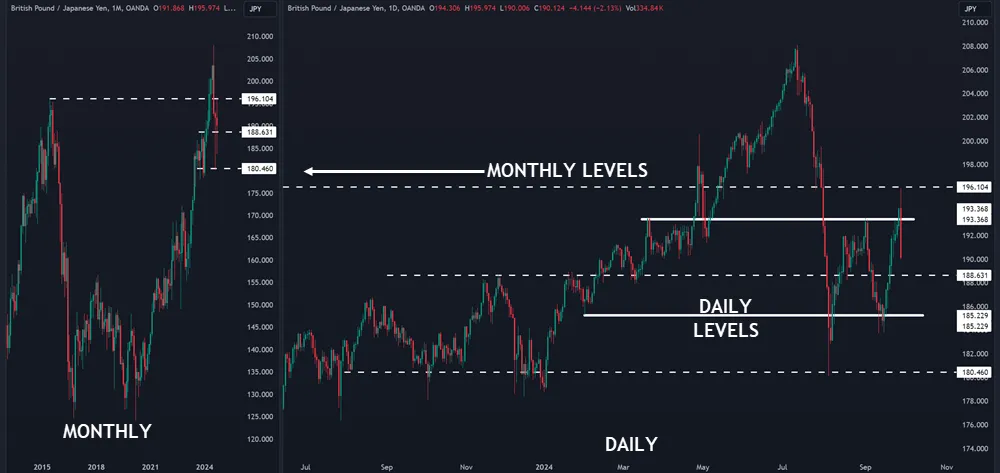
Building on your analysis of historical price action, it’s important to consider multiple timeframes when identifying support and resistance levels in forex. By examining charts across different periods, you’ll gain a more comprehensive view of market dynamics. This approach helps you spot key levels that mightn’t be apparent in a single timeframe.
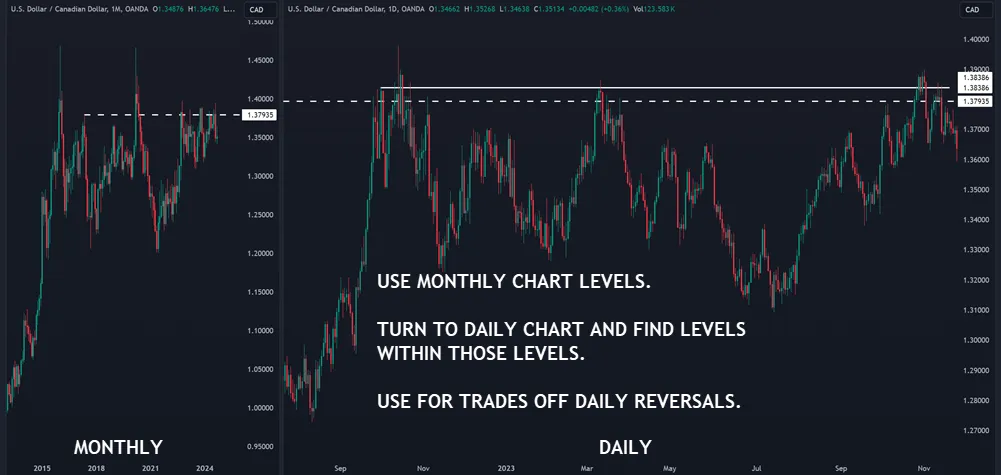
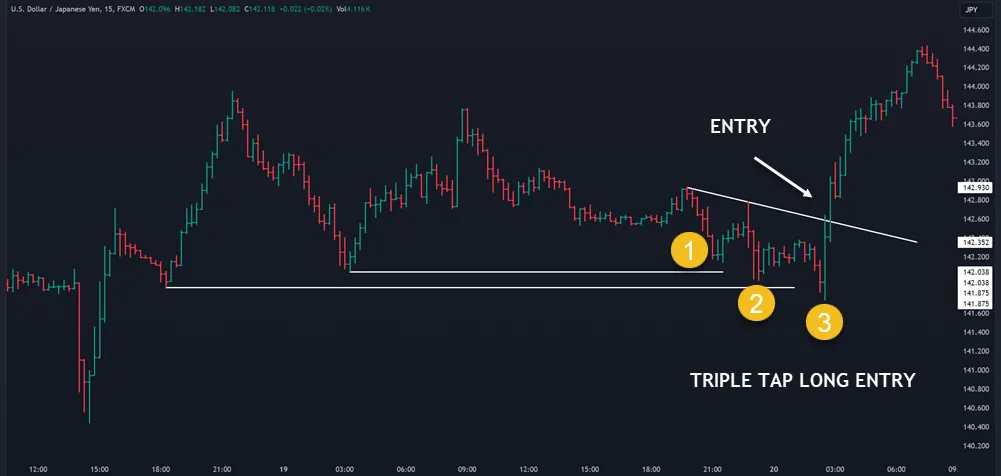
Start by looking at longer timeframes to identify major support and resistance areas. Then, zoom in to shorter timeframes to fine-tune your entry and exit points. You can also find minor zones inside of the major ones that have the potential to turn prices.
This method of timeframe alignment improves your ability to confirm trends and spot potential reversals.
Here’s why utilizing multiple timeframes is important:
- It gives you a broader perspective, helping you feel more confident in your trading decisions.
- You’ll experience less anxiety about missing important market moves.
- It can spark excitement as you discover hidden opportunities that others might overlook.
Incorporate Technical Indicators
Technical indicators can serve as valuable tools in your quest to identify support and resistance levels. They add an extra layer of confirmation to your analysis.
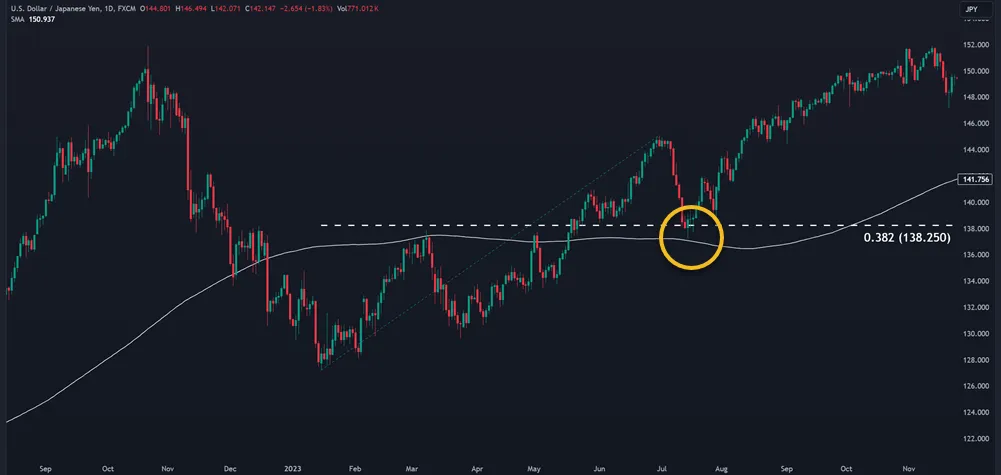
Two popular indicators you’ll want to consider are moving averages and Fibonacci retracement.
Moving averages smooth out price action over time, creating dynamic support and resistance lines. You’ll often see prices bounce off these averages (technically it’s price zones to the left of the average), especially on longer timeframes. For instance, the 200-day moving average is a widely watched level that can act as strong support or resistance.

Fibonacci retracement is another powerful tool. It helps you identify potential reversal points based on key ratios derived from the Fibonacci sequence. You’ll draw these lines between significant highs and lows, and they’ll show you where the price might pause or reverse.
When you’re using these indicators, remember they’re most effective when combined with other analysis methods. Don’t rely on them exclusively.
Instead, use them to confirm what you’re seeing in price action and chart patterns. This multi-faceted approach will give you a more comprehensive view of potential support and resistance levels.
Your Questions Answered
How Often Should I Update My Support and Resistance Levels?
You should update your support and resistance levels regularly. Check for support level updates daily and make resistance level adjustments weekly. As market conditions change, you’ll need to adapt your levels to stay on top of trends.
Can Support and Resistance Levels Be Used for All Currency Pairs?
You can use support and resistance levels for all currency pairs, but their effectiveness may vary. Consider each pair’s unique characteristics and historical performance. You’ll find some pairs respond better to these levels than others.
What’s the Best Way to Confirm a Breakout From Support or Resistance?
To confirm a breakout, you’ll want to use momentum analysis. Watch for increased trading momentum as price breaks through support or resistance. You should also look for strong candlestick patterns and wait for the price to retest the broken level. You could also switch to FX futures volume depending on the currency pair.
How Do News Events Affect Support and Resistance Levels in Forex?
News events can dramatically impact support and resistance levels in forex. You’ll notice increased volatility as markets react to breaking news. Watch for sudden price movements that may break through established levels, creating new support or resistance zones.
Are Psychological Levels Important When Identifying Support and Resistance in Forex?
Yes, psychological levels are valid in forex. You’ll find that these psychological barriers, like round numbers, often act as support or resistance. They’re important because trader psychology influences decision-making, causing many to place orders at these levels.
Conclusion
You’ve now got the tools to spot Forex support and resistance levels like a pro. Remember to study past price movements, look at different timeframes, and use indicators. These techniques will advance your trading skills and help you make better decisions.