If you are interested in exploring the world of the forex market, consider the 4-Hour MACD Forex Trading Strategy. This well-established approach focuses on long-term trading and uses the MACD indicator as a compass to direct your trades. The strategy is designed with distinct rules and provides objective signals for entering and exiting trades.

Although its win/loss ratio might be less than 50%, it’s essential to note that persistence and patience often pay off in forex trading. By focusing on time frames of 4 hours and above, you can significantly enhance your likelihood of profitable trades and not be whipsawed by lower time frame volatility.
Pretend you enter a trade based on a bullish MACD crossover on the 4-hour chart. You hold your position, despite the price moving slightly against you initially because the MACD indicator remains positive. Over the next day, the price moves in your favor, and you exit the trade with a profit when the MACD crosses back down.
This example shows how the 4-Hour MACD Forex Trading Strategy can work in a practical setting. It’s not about expecting every trade to be a win but understanding the larger trend and making educated decisions based on that. Remember, it’s not just about the waves you catch, but also about the storms you weather.
Prepare to navigate the forex market with the 4-Hour MACD Forex Trading Strategy.
Key Takeaways
Strategy Use: It’s an effective method for forex trading, utilizing the MACD indicator to identify buying and selling points.
Timeframe: Best applied over extended periods for clear, straightforward trading signals.
Entry and Exit Points: Enter trades when the MACD line crosses above the signal line (buying opportunity) and exit (sell) when it crosses below.
Risk Management: Includes setting stop loss levels where trend reversals seem likely, and take-profit levels at trend stalling or reversal points.
Patience and Discipline: Emphasizes the importance of careful market observation and timely decision-making.
Risk Mitigation: Aims to protect capital by avoiding excessive risks, and enhancing trading performance and profitability.
Understanding 4-Hour MACD Strategy
This method of trading requires an understanding of the MACD, or Moving Average Convergence Divergence, indicator. This tool is a favorite among forex market traders, as it aids in pinpointing the moments when a trend in the market is likely to reverse. It also guides traders to identify the optimal moments to either enter or exit a trade.

Imagine a trader watching their favorite currency pair. The MACD indicator constantly provides them with direction. When the MACD signals a possible trend reversal, the trader knows that it might be the perfect time to sell, just as the price peaks.
When the MACD indicates a good entry point, the trader takes that as their trigger to buy, just as the price begins to climb.
Understanding the Basics of MACD
This indicator forms the basis of the 4-hour MACD Forex Trading Strategy and is composed of two distinctive lines: the MACD line and the signal line.
The MACD line is the result of a simple mathematical operation. You subtract the 26-day exponential moving average (EMA) from the 12-day EMA. The signal line, however, is the 9-day EMA of the previously calculated MACD line.
These lines serve as signals for potential buying and selling opportunities. For example, when the MACD line rises and crosses over the signal line, it sends a bullish signal. This could be interpreted as an ideal moment to consider a buy trade.
On the flip side, if the MACD line drops and crosses below the signal line, it gives a bearish signal, showing it might be a great time to sell.
Rules for Long Trades

Let’s look at the steps for executing a long trade using the 4-hour MACD Forex Trading Strategy.
You need to establish if the market condition is favorable for a long trade. You can do this by ensuring the price is trending above the 89 Exponential Moving Average (EMA).
The MACD indicator is the tool for identifying bullish momentum. Specifically, you want this indicator to be above the zero line.
Observing if the MACD indicator reversing is an important step: Watch for it to dip and then climb back up again. This pattern indicates a potential opportunity to buy. Before the pullback on the MACD, we need to see momentum in the price – the first leg. This indicates not only momentum in the indicator but also through price action.
You’re now ready to enter the long trade. There are several options:
- Aim for a breakout above the nearest candlestick high by a margin of at least 10 pips.
- Look for a continuation chart pattern (my favorite is a bull flag) and a breakout through resistance
- Enter a trade when the MACD histogram turns positive OR with a higher low on the histogram
I also DO NOT want to see momentum against the overall trend during the MACD decline. This is a continuation trade and momentum against the main direction is always cause for concern.
Risk management is an integral part of any successful strategy.
Set your initial stop loss at a three to five-bar low from the entry price. For instance, if your entry price is 1.10, and the lowest price within five bars is 1.05, set your stop loss there.
Finally, knowing when to exit is just as important as knowing when to enter. Look for a multiple of your risk or when the MACD turns bearish.
Guidelines for Short Trades
Implementing short trades using the 4-hour MACD Forex Trading Strategy is the opposite of the buy signal.
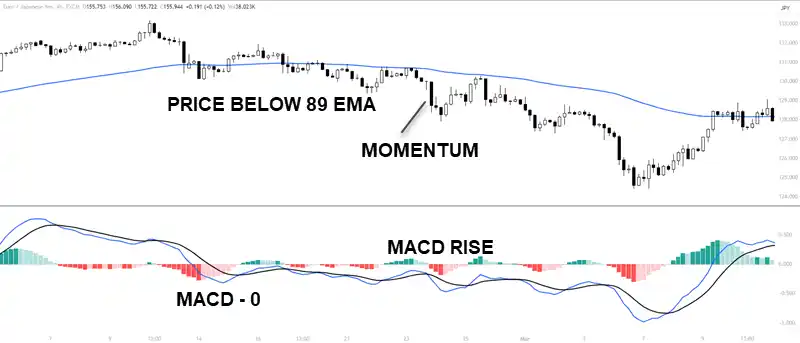
Here’s a detailed example: Imagine the market price is below the 89 EMA, which typically signifies a bearish trend. This is an initial indication that it may be a good time to consider sell trades (sell the base currency and buy the quote) To increase the likelihood of a successful trade, the MACD must also be below zero. This combination of conditions suggests that buy setups are less likely to be profitable.
Now, let’s assume the MACD begins to rise, then suddenly falls. This fluctuation is your cue to initiate a sell trade and leverage the market’s downward momentum to your advantage.
The following outlines the procedure for short trades using the MACD indicator and moving averages:
| Rule | Description |
| Price below 89 EMA | Verify the market price is below the 89 EMA, indicative of a bearish trend. |
| MACD below zero | Ensure the MACD is below zero, a potential precursor to a market reversal. |
| Sell as MACD rises/falls | As the MACD rises and then falls, execute a sell trade to benefit from the downward momentum. |
Sticking to these guidelines will allow you to manage your short trades effectively and increase your profit potential. Always use sound trade management practices, such as setting appropriate stop loss and take profit levels, to control risk and optimize your trading strategy. Maintaining this approach will offer you a robust and successful trading experience.
Trading Examples
Let’s look at some examples of the 4-hour MACD Forex Trading Strategy by examining three concrete examples that will help to elucidate this trading approach.
Firstly, consider a long trade on EUR/JPY. In this instance, the price had newly formed an uptrend, showed momentum, and went through a MACD/Price pullback.

MACD begins to show momentum back to the upside and price breaks out of the channel giving us a trade entry long.
In contrast, a short trade on GBPJPY offers a slightly different outcome and highlights the need to understand price action. Price forms a downtrend and then pulls back along with the MACD. Instead of immediate reversal, a trading range forms. Simply mark off the support zone of the trading range and look for the price and MACD to break downwards.

It takes a while for the trade to start working but ends with a dump of 495 pips before reversing. Entries depend on what you prefer: break of support, cross of the MACD or histogram showing bearish momentum. IMPORTANT: the histogram shows the relationship in distance between the two lines of the indicator.
Strategy Failure Indications
When using this Forex Trading Strategy, you might observe a certain pause or an indistinct dip under the moving average. This could potentially signal a time not to use the strategy. It’s essential to maintain an eye on the price action at your entry point, as this can provide insights into the strength of the breakout.
Let’s explore three indications that could suggest the strategy isn’t performing as expected:
- Frequent triggering of the stop loss: Imagine a scenario where you find your stop loss being activated time and again. This may suggest that the trading signal may not be as reliable as you initially thought. The root cause could be false breakouts or choppy market conditions.
- Inconsistent entry signals: Consider if the MACD shifts from positive to negative, leading to a series of failed signals. This can make it tough to precisely determine the entry points, which could result in losses and frustration.
- The trading trend is range-bound: The Hour MACD Forex Trading Strategy is most effective in trending markets. If the currency pair you’re trading is generally range-bound, it could be a tough task to pinpoint trustworthy trading opportunities.
Always monitor the condition of price action as we need a trending currency pair for this to work. It’s a continuation pattern and you need price to have a direction to continue moving in.
MACD Settings for Day Trading
In day trading, understanding the MACD (Moving Average Convergence Divergence) settings is like understanding the language of the market. This “conversation” between traders and the market is facilitated by the 3/10 Oscillator, a component of the Hour MACD Forex Trading Strategy.
This oscillator, without the histogram component, is the 3 fast line, a steady 10 slow line, and a 16 smoothing (all set to SMA). These components work together to show you short-term momentum and medium-term trend direction.
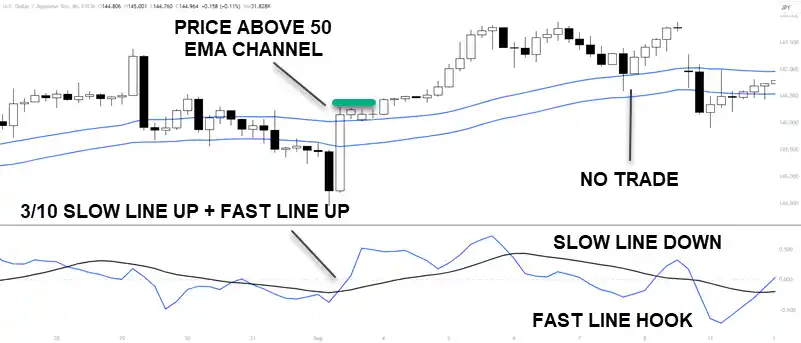
For instance, the 3-period blue line, also known as the MACD line, is like a pulse meter, tracking the market’s short-term momentum. On the other hand, the 10-period orange line, or MACD signal line, serves as a compass, pointing out the medium-term trend direction. Two 50 EMA (Exponential Moving Average) lines interlace to form a channel giving us the direction to trade in.
Our example above: slow line and fast line up as price above 50 EMA = trade. Slow line down and fast line hook is not a long trade even if the price is showing upward movement.
Risk Management in 4-Hour MACD Forex Trading
The use of risk management strategies is important to protect your capital and help mitigate potential losses. Let’s look at three significant aspects of risk management that you can apply to this trading strategy:
- Establishing Suitable Stop Loss Levels: To start, you need to identify the maximum loss you’re prepared to absorb for each trade. This decision can be influenced by factors such as the size of your trading account and your personal risk tolerance. For instance, if you have a large trading account and a high-risk tolerance, you might set a wider stop loss. A smaller account and a lower risk tolerance may necessitate a tighter stop loss. By setting a stop loss, you create a safety net that allows you to exit a trade if the price moves unfavorably, thus protecting you from further financial damage.
- Adapting Stop Loss Based on Price Fluctuations: As the price begins to move in your favor, it’s wise to adjust your stop loss to secure profits. For example, if your initial stop loss was set at 30 pips below the entry price and the price has moved 20 pips in your favor, you might consider moving your stop loss to 10 pips below the entry price. This strategy of locking in profits can preserve your capital and mitigate the risk of surrendering your gains.
- Utilizing True Range for Risk Evaluation: Using the true range indicator to gauge the market’s volatility. This tool can assist you in setting the appropriate stop loss and take profit levels for each trade, accounting for the current market conditions. For instance, in a highly volatile market, you might choose a larger stop loss to avoid being stopped out prematurely.
Advanced Techniques and Tips for the 4-Hour MACD Strategy
There are certain techniques that, when mastered, can greatly improve your trading prowess. One technique involves the use of trend line breaks and chart patterns, both reversal and continuation. These can serve as reliable indicators for entry and exit points, enhancing the precision of your trading decisions.

Imagine a line connecting the peaks and troughs of a price chart. This is what we call a ‘trend line’. When this line breaks, it signals a potential reversal – the price may be about to change direction – or a continuation – the price may keep moving in its current direction. By spotting these breaks, you can enter or exit trades at the most opportune moments using an objective entry trigger.
Now, let’s add another layer of complexity – chart patterns. These are specific formations that prices create, such as the ‘double tops‘, the ‘head and shoulders’, or the ‘flags’. Recognizing these patterns can provide a strong confirmation of the market’s direction, effectively bolstering your trading strategy.
For instance, imagine a ‘double top’. This pattern is formed when the price reaches a certain high point twice, unable to break through, before eventually dropping. Such a pattern, when spotted, can be a clear sign of an upcoming price reversal.
A ‘head and shoulders‘ pattern resembles, as the name suggests, a head with two shoulders. This pattern is indicative of a potential price reversal. Conversely, ‘flags‘ are small rectangles that form during a trend, signifying a continuation.
Frequently Asked Questions
What Is the Best Time Frame for MACD Forex?
The best time frame for using the MACD indicator in Forex trading is typically the 4-hour chart. This time frame provides a balanced view of the market, offering reliable signals for both short-term and long-term traders.
What Is the Best MACD Setting for a 1-Hour Chart?
The best MACD setting for a 1-hour chart is often a 3-period fast line, a 10-period slow line, and a 16 smoothing period, known as the 3/10 Oscillator. This configuration provides a balance between real-time responsiveness and trend identification, making it suitable for short-term trading in a 1-hour timeframe.
Does MACD Strategy Work in Forex?
Yes, the MACD (Moving Average Convergence Divergence) strategy can be effective in Forex trading when used correctly. It serves as a valuable tool for identifying buy and sell signals, helping traders make informed decisions. Success with this strategy depends on patience, optimal settings, and careful observation of market trends.
What Is the Best Strategy for MACD Trading?
The best strategy for MACD (Moving Average Convergence Divergence) trading involves using the MACD indicator to identify potential buy and sell signals. This strategy relies on observing the MACD line crossing above the signal line as a buy signal and crossing below as a sell signal. You need to exercise patience and choose appropriate time frames for trading to maximize the effectiveness of this strategy.
Conclusion
The 4-Hour MACD Forex Trading Strategy offers a robust approach for forex traders, leveraging the MACD indicator to pinpoint opportune buy and sell signals. This strategy thrives on patience, careful observation, and disciplined risk management. By following its rules and focusing on extended time frames, traders can improve their trading performance, potentially giving you profitable results while trading in the FX market.