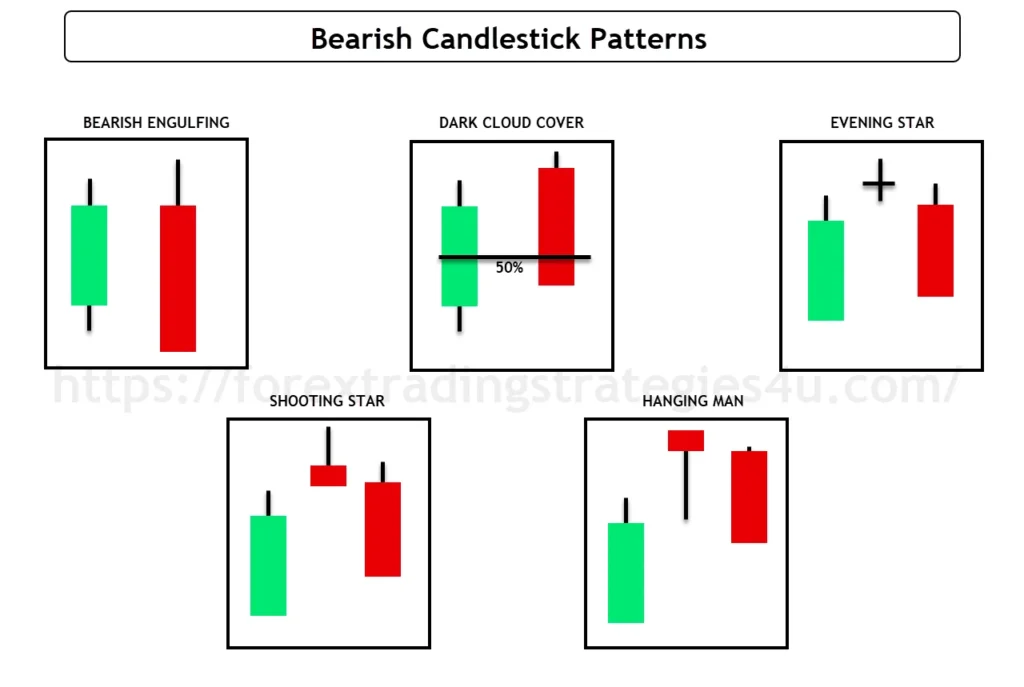
You’ll want to watch for five key bearish candlestick patterns that signal potential market downturns. The Bearish Engulfing shows a large red candle swallowing a smaller green one, while the Dark Cloud Cover reveals a bearish close below the prior candle’s midpoint. The Evening Star, Shooting Star, and Hanging Man patterns each mark distinct shifts from buyer to seller control. Understanding these patterns gives you powerful tools to protect your trading capital.
Get our exclusive report – a strategy to Trade FOREX using the 50 EMA. DOWNLOAD NOW
Quick Overview
- Bearish Engulfing pattern signals trend reversal when a large red candle completely covers the previous green candle’s trading range.
- Dark Cloud Cover forms when a bearish candle opens higher but closes below the midpoint of the previous bullish candle.
- Evening Star patterns show transition from bullish to bearish control through three candles: bullish, indecision, and bearish.
- Shooting Stars warn of potential reversals with small bodies at the bottom and long upper shadows during uptrends.
- Hanging Man formations appear at uptrend peaks with small bodies and long lower shadows, indicating increasing selling pressure.
Understanding Bearish Engulfing Pattern’s Key Signals
One of the most reliable bearish reversal signals, the Bearish Engulfing Pattern, consists of two candlesticks. The first is a small bullish candle, followed by a larger bearish candle that completely engulfs the previous one. This pattern often appears at the end of an uptrend, signaling a potential reversal.
Note: some traders consider the engulfing of the real body only as sufficient
To identify this pattern, you’ll need to look for a small green candle followed by a red candle that opens higher and closes lower than the previous day’s range. It’s crucial to consider the context of the overall trend and look for bullish confirmation before making any trading decisions.
When using the Bearish Engulfing Pattern in your entry strategy, do you wait for additional confirmation, such as increased volume (FX Futures) or a break below a key support level? Some traders do. You might consider placing a stop-loss order just above the pattern’s high point to manage risk.
Dark Cloud Cover: A Powerful Reversal Indicator
While the bearish engulfing pattern gives us a two-candle warning sign, the dark cloud cover pattern works in a slightly different way.
Following the Bearish Engulfing Pattern, we see the Dark Cloud Cover, another potent bearish reversal signal. This pattern forms at the end of an uptrend and consists of two candlesticks. The first is a long white (or green) candle, followed by a black (or red) candle that opens above the previous day’s high but closes below the midpoint of the white candle’s body.
The Dark Cloud Cover reflects a shift in market psychology. It shows that while bulls initially pushed prices higher, bears ultimately took control, causing a significant price drop. This pattern suggests a potential market reversal, as it indicates weakening bullish momentum and growing bearish pressure.
To identify a Dark Cloud Cover, look for these key elements:
- An ongoing uptrend
- A long white (green) candle
- A black (red) candle opens above the white candle’s high
- The black candle closing below the midpoint of the white candle
When you spot this pattern, consider closing long positions or preparing for potential short entries. However, always confirm the reversal with other technical indicators and market factors before making trading decisions.
Breaking Down the Evening Star Formation
When you’re scanning price charts for bearish signals, the evening star formation is one of the most reliable reversal patterns you’ll encounter.
The Evening Star Formation is a three-candle bearish reversal pattern that signals a potential shift from an uptrend to a downtrend. You’ll spot this pattern at the end of an uptrend, consisting of a large bullish candle, followed by a small-bodied candle, and ending with a large bearish candle.
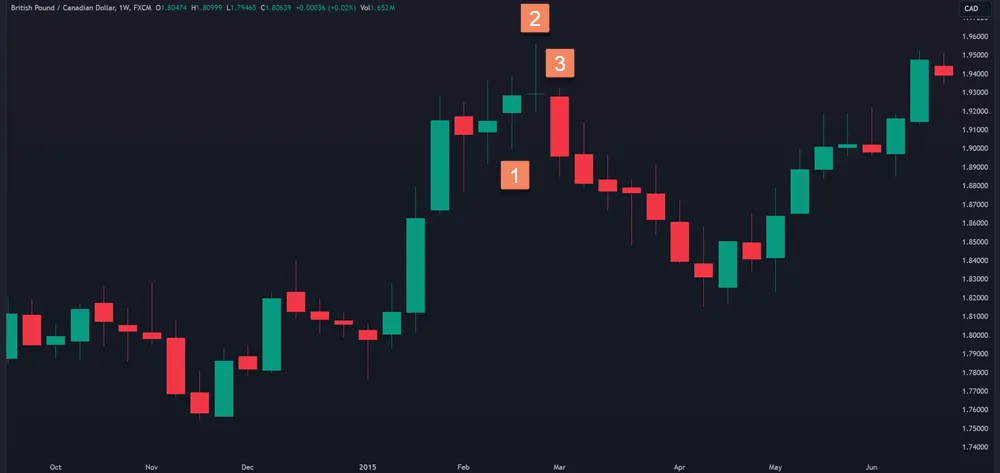
The first candle shows strong buying pressure, but the second candle reveals uncertainty in the market. This indecision leads to the third candle, which confirms the bearish sentiment.
You should pay close attention to this pattern as it often indicates a significant trend reversal. The evening star implications can be powerful. When you see this formation, it’s a sign that the bulls are losing control and the bears are taking over.
You might consider selling your long positions or entering short trades. However, always confirm this pattern with other technical indicators and market context. Remember, no pattern is foolproof, so use risk management strategies to protect your investments.
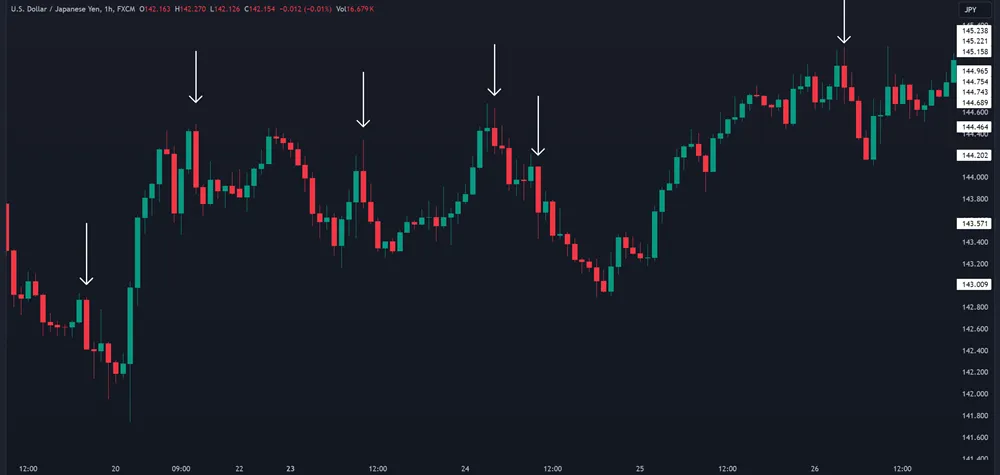
Mastering Shooting Star Pattern for Trading Success
You’ll recognize the Shooting Star Pattern by its distinctive shape: a small body near the bottom of the candle with a long upper shadow and little to no lower shadow.
The shooting star characteristics include a price that opens, trades much higher, and then closes near the opening price. This action creates a candle that looks like a shooting star, with its long wick pointing upward.
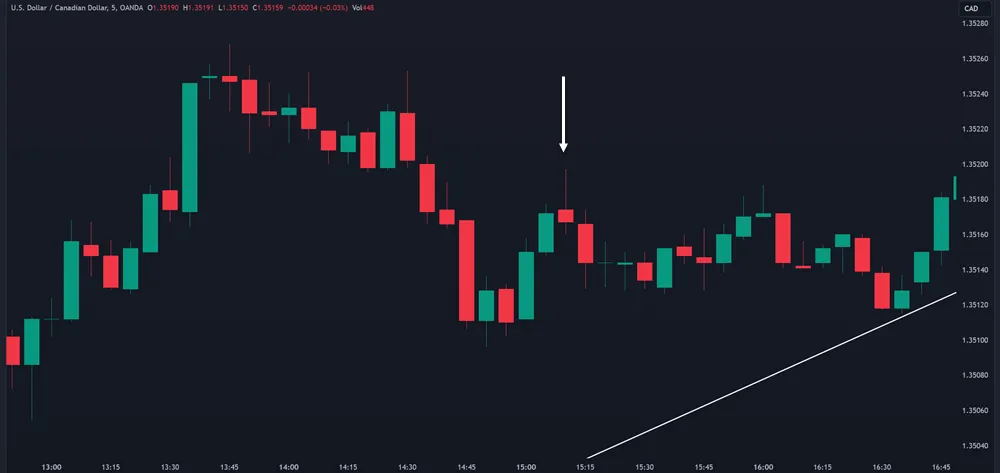
It signals that buyers initially pushed the price up, but sellers eventually took control, pushing it back down.
When you spot a shooting star, it’s essential to consider the context. It’s most reliable when it appears after a prolonged uptrend.
To incorporate this into your trading strategies, look for confirmation in the following days. A bearish candle or increased selling volume can strengthen the signal.
You might consider setting a stop-loss just above the shooting star’s high and targeting a price near recent support levels for potential profits.
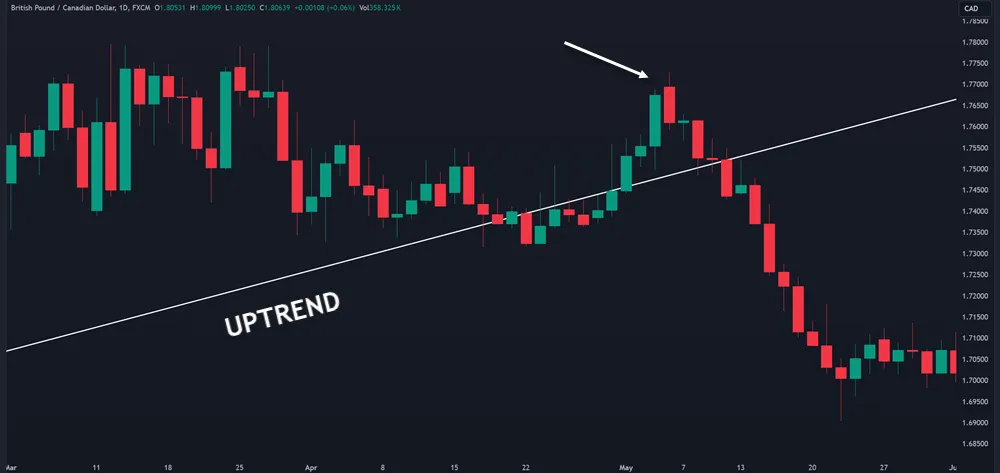
Hanging Man: Spotting the End of a Bullish Run
Similar to its cousin the shooting star pattern, a hanging man formation can signal trouble ahead for bullish traders. Resembling an inverted hammer, the Hanging Man candlestick is a bearish reversal pattern that appears at the end of an uptrend.
It’s characterized by a small body at the top of the candle with a long lower shadow, typically at least twice the length of the body. The color of the body isn’t crucial, but a red (or black) body can strengthen the signal.
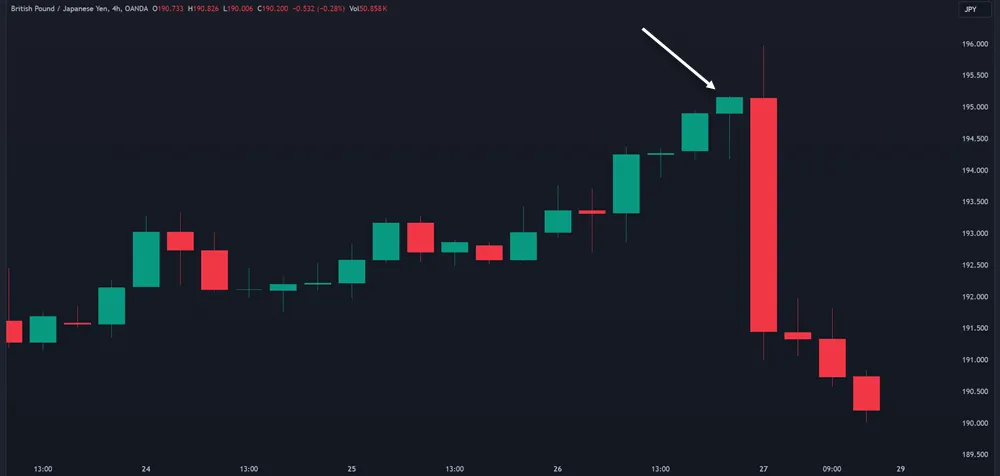
The hanging man psychology reflects a shift in market sentiment. Despite the uptrend, sellers have pushed prices significantly lower during the trading session, even though buyers eventually regained control. This struggle indicates that the bulls might be losing their grip.
You’ll want to see a bearish candle following the hanging man to confirm a hanging man pattern. This hanging man confirmation suggests that sellers are indeed taking charge.
It’s also helpful to look for increased trading volume on the hanging man candle, as this can strengthen the signal.
Your Questions Answered
How Do Candlestick Patterns Differ From Other Technical Analysis Tools?
Unlike other technical analysis tools, candlestick patterns offer you a visual representation of market psychology. They provide a deeper understanding of short-term price movements and trader sentiment. You’ll find them more intuitive for quick trend analysis and decision-making in trading.
Can Bearish Candlestick Patterns Be Used in Cryptocurrency Trading?
Yes, you can use bearish candlestick patterns in cryptocurrency trading. These patterns will be useful in any market.
What Timeframes Are Most Effective for Identifying Bearish Candlestick Patterns?
You’ll find bearish candlestick patterns most effective on shorter timeframes for quick trades. Use 15-minute to 4-hour charts for short-term analysis. However, don’t ignore daily and weekly charts to confirm long-term trends and ensure you are trading in a stronger direction.
How Reliable Are Bearish Candlestick Patterns in Predicting Market Reversals?
You’ll find bearish candlestick patterns can be reliable reversal signals, reflecting market psychology. However, they’re not perfect. You should use them with other technical indicators and fundamental analysis for more accurate predictions.
Are There Any Software Tools Specifically Designed for Candlestick Pattern Recognition?
You’ll find numerous software tools designed for candlestick pattern recognition. They can help identify patterns quickly but don’t rely solely on them. Remember, trading psychology plays a role in interpreting these signals and making your trading decisions.
Conclusion
By mastering these five bearish candlestick patterns, you’ve added valuable tools to your trading toolkit. You’ll now spot potential market reversals more easily and protect your investments better. Remember that these patterns work best when you combine them with other technical indicators and market analysis. Keep practicing spotting these formations in real-time charts, and you’ll naturally develop stronger trading instincts.