The James16 methodology focuses on price action as the “ultimate market truth”. You’ll find success by mastering double bar patterns (DBLHC for buys, DBHLC for sells) and using moving averages (21, 89, and 365) as dynamic support/resistance levels.
Combine these with Keltner Channels to assess volatility and maintain strict risk management (1-2% per trade). This simplified approach eliminates indicator confusion and helps you spot high-probability setups. The sections below will go over each trading technique.
Overview
- Price action patterns like DBLHC and DBHLC form the foundation of James16 methodology for identifying trade opportunities.
- James16 traders use 21, 89, and 365 moving averages as dynamic support/resistance levels to confirm trend direction.
- Keltner Channels help James16 followers identify overextended markets and potential reversal points.
- Risk management limits exposure to 1-2% per trade with stops placed 2-5 pips below support or above resistance.
- The methodology emphasizes simplicity, patience, and trading with confluence signals rather than relying on complex indicators.
Core Philosophy | James16 Trading
At the heart of the James16 trading methodology lies a refreshingly simple philosophy: price represents the ultimate truth in markets.
When you understand this concept, you’ll see trading through a clearer lens where market sentiment becomes visible through price action patterns.
The cornerstone principles include:
- Trust what you see, not what you think should happen
- Develop trading psychology that values patience over impulsivity
- Recognize that price patterns reveal the invisible hand of market participants
- Accept that simplicity trumps complexity in sustainable trading performance
Your success depends on respecting these fundamentals rather than chasing indicators. Unlike strategies that rely heavily on EMA crossovers for entry signals, James16 methodology focuses on pure price action without lagging indicators.
This approach emphasizes analyzing candlestick patterns to identify potential market reversals and continuation signals.
James 16 Components
Let’s explore these seven key components of the James16 forex trading methodology that can transform your approach to market analysis.
These essential sections include:
- Price Action Fundamentals
- Support and Resistance Identification
- Multiple Timeframe Trend Analysis
- Reversal Pattern Recognition
- Entry and Exit Strategy Development
- Risk Management Techniques
- Trading Psychology Mastery
These elements working together create a comprehensive trading system. They’re designed to help you recognize genuine trading opportunities while avoiding emotional traps.
The beauty of James16’s approach is how simple it really is —you won’t need dozens of indicators cluttering your charts to make confident trading decisions.
The course emphasizes understanding market psychology and trader behavior as key components for successful price action trading.
Many traders complement this methodology with the 20-period MA to validate potential trend reversals and identify optimal entry points during pullbacks.
6 Main Price Patterns
These are the 6 main price action patterns James16 uses:
- Double Bar Low Higher Close-DBLHC
- Double Bar High Lower Close-DBHLC
- Two Or More Matching Highs Or Lows. The condition with this is that they must be within 2 pips of each other. If the low or the high is broken, it indicates that the current trend will continue.
- Bearish Outside Vertical Bar(Bearish Engulfing Pattern)-BEOVD–
- Bullish Outside Vertical Bar (Bullish Engulfing Pattern)-BUOVB
- Pin Bars
PRICE ACTION PATTERN #1: DBLHC
- The DBLHC stands for Double Bar Low Higher Close and it is a bullish chart pattern which means you should be looking for this pattern in an uptrend market.
- How do you spot this pattern? Well, look for 2 bars that have lows that are on the same price level or within 2 pips of each other, but the 2nd bar must have a close that is higher than that of first bar.
- How do you trade the DBLHC pattern? You can buy at market order as soon as 2nd bar closes or place a pending buy stop order just 2-3 pips above the high of the 2nd candlestick.
- For your stop loss, place it 2-5 pips below the low of the 2nd candlestick in the pattern.

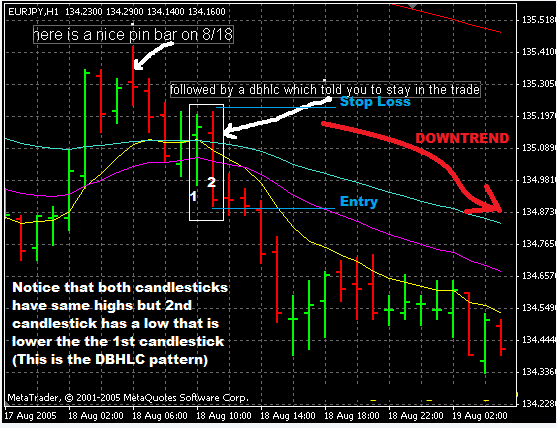
JAMES16 FOREX PATTERN #2: DBHLC
- DBHLC stands for Double Bar High Lower Close and it is a bearish chart pattern which means you should be looking for this chart pattern when the market is in a downtrend.
- How do you spot the DBHLC chart pattern then? Look for 2 bars that have highs that are almost on the same price level or within 2 pips of each other but the 2nd bar must have a close that is lower than that of first bar. See chart below.
- How do you trade the DBHLC pattern? There are two possible options here: sell at market order as soon as 2nd bar closes or you can place a pending sell stop order 2-3 pips below the low of the 2nd candlestick.
- For you stop loss, place it 2-3 pips above the high of the 2nd candlestick in the pattern.
JAMES16 PATTERN #3: TWO OR MORE MATCHING HIGHS/TWO OR MORE MATCHING LOWS
#3a: Two Matching Highs Pattern:
- How Do You spot 2 Matching Highs chart pattern?: You look for 2 bars that have highs that are almost on the same price level or within 2 pips of each other
- Two Matching highs pattern is considered a bullish forex chart pattern so you should be looking for this chart pattern in an uptrend market.
- How do you trade the two matching highs pattern: you have two options… first is to buy at market order as soon as 2nd bar closes or the second option is to place a pending buy stop order 2-3 pips above the high of the 2nd candlestick.
- For your stop loss, place it 2-5 pips below the low of the 2nd candlestick in the pattern.

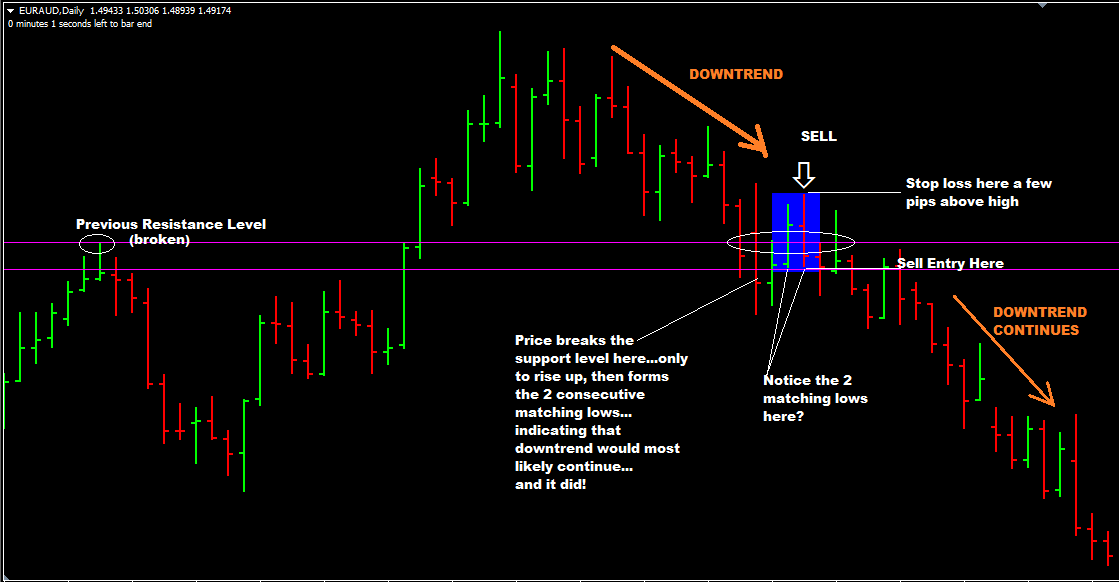
#3b: Two Matching Lows Forex Chart Pattern
- How do you spot two Matching Lows Forex Chart Pattern? Well, you should Look for 2 bars that have lows that are almost on the same price level or within 2 pips of each other
- The Two Maching Lows Pattern is considered a bearish forex chart pattern which means you should be looking for this chart pattern in a downtrend market.
- How do you trade the two maching lows pattern? Again, you have two options: you can sell at market order as soon as 2nd bar closes or place a pending sell stop order just 2-5 pips below the low of the 2nd candlestick.
- For your stop loss, place it 2-5 pips above the high of the 2nd candlestick in the pattern.
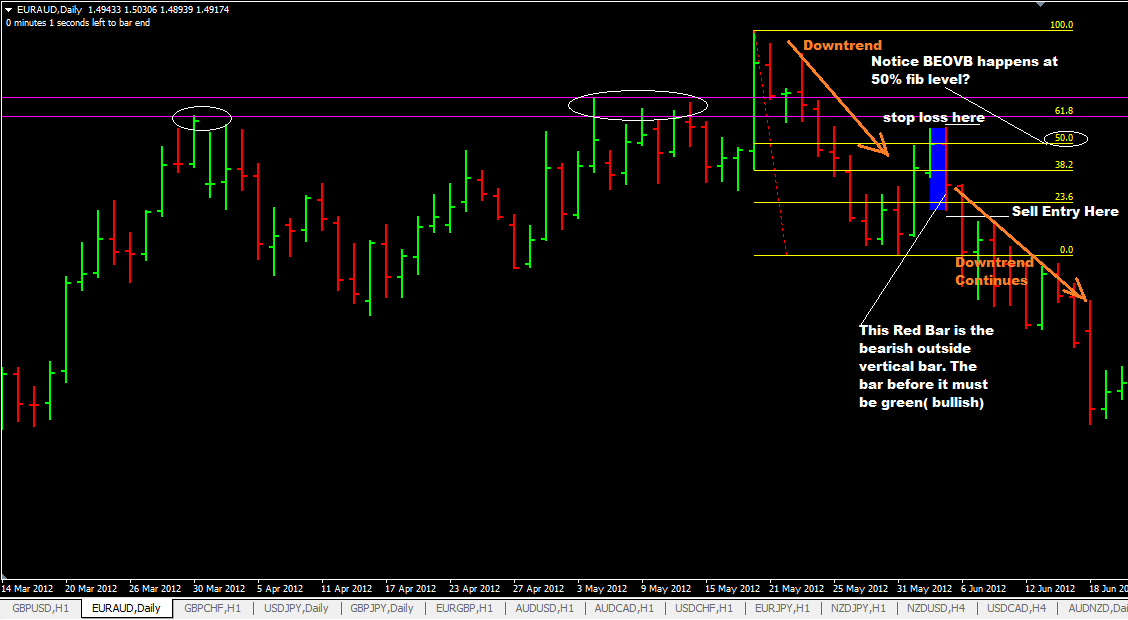
JAMES16 CHART PATTERN #4: BEOVB
- Bearish Outside Vertical Bar–BEOVB is a bearish forex chart pattern so look for this pattern when the market is in a downtrend.
- How do you spot the BEOVB Pattern? It is a 2 bar chart pattern, the first bar must be a bullish bar (green) and the second bar must be bearish which overshadows the first bar because its high may be a few pips higher than than that of the first bar and its low may be a few pips or more lower than the 1st bar.
- How do you trade the BEOVB pattern? You have two options…first option is to sell at market as soon as second bar closes. The second options is to place a pending sell stop order just 2-3 pips below the low of the second candlestick.
- For your stop loss, place it 2-5 pips above the high of the second candlestick in the pattern.
JAMES16 CHART PATTERN #5: BUOVB
- BUOVB stands for Bullish Outside Vertical Bar and it is a bullish pattern which means you look for this pattern only when the market is in an uptrend.
- How do you spot the Bullish Outside Vertical Bar pattern? Well, it is a 2 bar chart pattern and the first bar must be a bearish bar (red) and the second bar must be bullish (green bar) which overshadows the first bar because its high may be a few pips more higher than that of the first bar and its low may be a few pips or more lower than the first bar.
- How do you trade the bullish outside vertical bar pattern?: There are two options, buy at market order as soon as 2nd bar closes or you can use a pending buy stop order just 2-3 pips above the high of the 2nd candlestick.
- For your stop loss, place it 2-5 pips below the low of the 2nd candlestick in the pattern.

JAMES16 CHART PATTERN # 6: Pin Bars
Pin Bar Fact#1:
A Pin Bar is “NOT” a doji candlestick or a hanging man candlestick.
A pin bar is a very unique candlestick because it shows rejection of a price level via very long tail or spike and this tail or spike is much larger/longer than the entire candlestick body.
Not all pin bars are created equal. The location of where the pin bar forms is very important. Just because you see a pin bar form on the chart doesn’t mean its a good pin bar that you can trade.
Pin Bar Fact#2:
If you want to trade the pin bar, you trade in the opposite direction of the tail.
For a bullish pin bar, the tail will be pointing down, then you buy.
For a bearish pin bar, the tail will be pointing up, then you sell the tail is pointing up then you sell.
Pin Bar Fact#3:
The probability of success in trading pin bars is higher in larger time frames like the 4hr and daily.
Pin Bar Fact#4:
I mentioned previously that not all pin bars are created equal. If pin bars form in areas of confluence, then you should take notice of such because the chances of taking trades that go successful are good.
You should also look at trading pin bars that form at swing lows in an uptrend
The opposite is also true, look for pin bars in swing highs in a downtrend and if a pin bar forms, take a short trade.
Ideally, if you see a pin bar make a “false-break” or rejection of a key price level then that’s a very good signal to trade.
Pin Bar Fact#5:
You can also watch exponential moving averages for pin bar trading setups. The EMAs that you can use are:
- the 8 and 21 period EMAs
- the 9 and 18 period EMAs
- the 7 and 14 perioud EMAs
Pin Bar Fact #5:
Did you know that Pin bars can be traded successfully in both range bound and trending market conditions? Guess what? This fact alone makes trading pin bars one of the most versatile forex systems out there.
For those trades that may find it hard to understand, this is generally how you trade pin bar trading setups:

Risk Management Principles in the James16 Framework
While powerful confluence signals can identify promising trade opportunities, the James16 framework places equal weight on protecting your capital.
This approach emphasizes setting your stop loss based on the specific pattern you’re trading, typically 2-5 pips below support for long trades or above resistance for shorts.
Always align your position size with your risk tolerance, never risking more than 1-2% of your account on a single trade.
Your Questions Answered
How Long Does It Typically Take to Master James16 Trading Strategies?
You’ll typically need 6-12 months for James16 trading mastery timeline. Your learning curve depends on practice frequency, market understanding, and ability to recognize price action patterns consistently.
Can James16 Methods Be Applied to Cryptocurrency Markets Effectively?
Yes, you can apply James16 methods to crypto markets. Crypto price action follows similar patterns, though volatility differs from forex crossover scenarios. Adapt your support/resistance analysis accordingly.
What Timeframes Work Best With James16 Price Action Patterns?
You’ll find James16 price action patterns work on multiple timeframes, but daily and 4-hour charts provide clearer setups with less noise for ideal timeframe selection in trending markets.
Does the James16 Strategy Require Specific Broker Conditions?
James16 strategy doesn’t require specific broker conditions. You’ll need reliable trading platforms with accurate price feeds and low spreads to properly identify the price action patterns.
How Has the James16 Strategy Evolved Since Its Original Forum Days?
Since the forum days, James16’s strategy has evolved through community influence, emphasizing trading psychology more heavily. You’ll find traders have refined pattern recognition while maintaining the core price action principles.