You’ve likely come across the Hanging Man candlestick pattern during your trading journey. Positioned at the peak of an uptrend, this bearish signal might be telling you more than just the immediate sentiment of traders. It’s essential to understand not only its appearance—a small body with a long lower shadow—but also the underlying market psychology it suggests.

Why might this pattern indicate a selling pressure despite the prevailing upward trend? Consider how this could reshape your trading strategies, especially when combined with other technical analysis tools. What happens next in the market could very well hinge on your interpretation of these signals.
FREE 50 EMA TRADING STRATEGY – DOWNLOAD HERE
Main Points
- The Hanging Man candlestick pattern indicates a potential bearish reversal after an uptrend.
- It features a small body at the top with a long lower shadow, at least twice the body’s length.
- Confirmation from subsequent trading sessions is crucial to validate the pattern’s reversal signal.
- The high trading volume during the pattern’s formation strengthens its reliability as a bearish indicator. (FX Futures)
- Effective trading strategy involves waiting for a close below the Hanging Man’s low before executing a sell.
Understanding Candlestick Patterns
Originating from Japanese rice traders in the 18th century, these patterns have evolved into a critical aspect of technical analysis in today’s financial markets. By understanding these patterns, you’re tapping into centuries of trading wisdom, enabling you to find clues into potential market trends and price shifts with greater accuracy.
Each candlestick pattern tells a unique story about the market’s behavior over a specific period. These patterns are formed based on the opening, high, low, and closing prices of a stock. Recognizing these can help you anticipate future movements by revealing the psychological aspects of market participants.

For instance, a long lower shadow indicates that sellers pushed the price down, but buyers managed to overcome this selling pressure, closing the stock near its opening level. This battle between buyers and sellers is pivotal in identifying potential reversals or continuations in the market trend.
Identifying the Hanging Man
Now, let’s focus on the Hanging Man candlestick pattern, a significant indicator of potential market downturns. When you’re examining FX charts, spotting this pattern can be useful for anticipating future price movements.
The reliability of the Hanging Man pattern often depends on the prevailing market conditions; it’s generally seen as a stronger bearish signal in a rising market where buyers are losing momentum.

To effectively identify the Hanging Man, you need to take into account both the shape and the context of the pattern. It typically appears at the end of an uptrend, signaling that the selling pressure is beginning to outweigh the buying pressure. However, confirmation is key, as the pattern’s reliability can be influenced by subsequent trading sessions.
The only way you truly know it is the end of the uptrend is a full price reversal.
Formation and Features
The Hanging Man shows up as a small body at the top of a trading session’s range, supported by a long lower shadow, which indicates a significant sell-off during the period. This pattern, often a sign of potential reversals, provides an important visual through which to analyze ongoing bullish sentiments.

To fully understand the meaning, consider the following features:
- Color Significance: The color of the Hanging Man candlestick holds meaning. A red or black body typically implies a stronger bearish confirmation compared to a green or white body, which suggests less selling pressure.
- Volume Correlation: Volume plays an essential role in validating the Hanging Man. Increased volume during the formation of this pattern suggests a more robust signal, indicating that more traders participated in the sell-off, reinforcing the potential for a downward trend. If using volume, you will need to use the FX Futures volume.
- Shadow Length: The long lower shadow should be at least twice the size of the body. This feature is important as it reflects the extent of the sell-off and subsequent buying pressure that failed to sustain higher prices.
- Positioning: Placement at the peak of an uptrend is significant. The appearance of the Hanging man after substantial upward price movements signifies exhausted buying momentum, making the pattern more reliable.
Understanding these elements helps you anticipate potential market shifts, enabling a proactive rather than reactive trading strategy.
Psychological Interpretation
Understanding the Hanging Man candlestick pattern from a psychological perspective reveals how traders’ fears and uncertainties show up in market behavior. This pattern, appearing at the peak of an uptrend, indicates a significant sell-off during the trading session.
However, the market’s ability to pull back near the opening price reflects uncertainty among traders.
You can see that the market sentiment is initially optimistic but shifts rapidly as selling pressure increases. The appearance of the Hanging Man suggests that buyers are losing control and fear is beginning to set in. This fear stems from traders questioning whether the current price levels are sustainable, leading to an increased state of price volatility.
| Emotion | Market Impact | Investor Action |
|---|---|---|
| Optimism | High opening price | Buying begins |
| Uncertainty | Price drops sharply | Hesitation increases |
| Fear | Minimal price recovery | Selling intensifies |
| Doubt | Close near open | Caution dominates |
| Tentative Hope | Slight close above low | Limited buying resumes |
As you analyze this table, you’ll notice how each emotional shift ties back to market actions and reactions, shaping the overall market environment. The psychological analysis helps in understanding the depth of market sentiment and the critical role it plays in decision-making during periods marked by uncertainty.
Trading Strategy Tips
Recognizing the psychological shifts associated with the Hanging Man pattern, you should adjust your trading strategies to exploit them.
Here are important strategies to keep in mind:
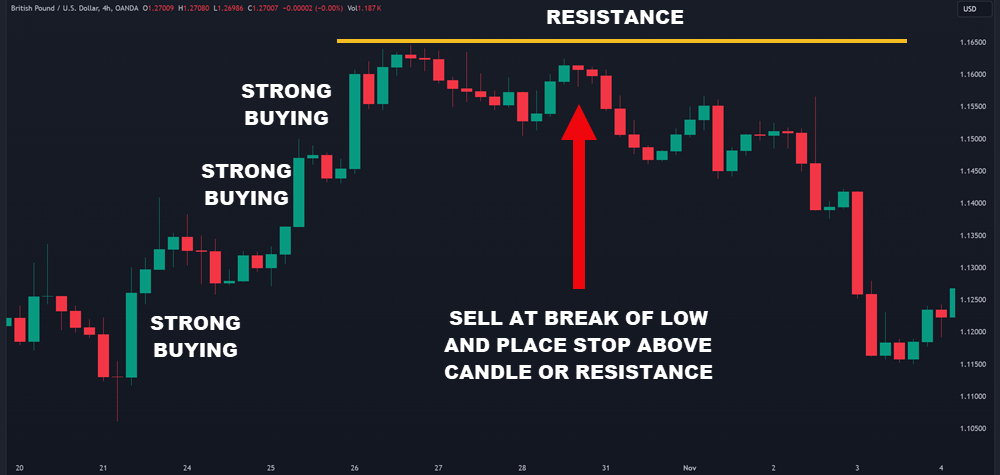
- Identify Strong Resistance Levels: Before acting on a Hanging Man pattern, it’s vital to confirm its presence at a significant resistance level. This verification improves the reliability of the pattern and provides safer entry points for your trades.
- Wait for Confirmation: Don’t rush your entry after spotting a Hanging Man. Wait for the next candle to close below the Hanging Man’s low. This serves as validation and helps in minimizing failed signals.
- Set Tight Stop-Losses: To manage risk effectively, place your stop-loss just above the Hanging Man’s high. This limits potential losses if the market direction unexpectedly reverses, protecting your investment from significant downturns.
- Monitor Volume: Increased volume during the formation of a Hanging Man can indicate stronger seller momentum. It’s wise to analyze volume as it adds another layer of confirmation and helps in gauging the strength of the bearish sentiment.
The most important aspect is to ensure you are seeing strong buying interest before the candlestick appears. An overextended instrument has a higher chance of reversing than does a slow-moving currency.
Frequently Asked Questions
How Does Volume Impact the Reliability of a Hanging Man Pattern?
In analyzing trends, understanding how volume impacts pattern reliability is essential. Volume significance can’t be overstated; it serves as a confirmation for any observed patterns.
Higher volume indicates stronger market consensus, giving more credibility to the patterns you’re observing. When you spot a potential signal, verifying it with volume data guarantees that you’re making decisions based on data, reducing risk and enhancing the chances of a successful trade. Use FX Futures for volume.
What Are Common Misinterpretations of the Hanging Man Pattern?
You might often misinterpret the necessity for confirmation and the relevance of the timeframe when analyzing downward trend signals. It’s important to keep in mind that without proper confirmation, you’re likely jumping to assumptions based on incomplete information.
Additionally, the significance of these signals can vary greatly depending on whether you’re looking at data from minutes, hours, or days. Always make sure that your analysis considers these aspects to avoid mistakes in your strategy.
How Does the Hanging Man Pattern Differ in Forex Versus Stock Markets?
When analyzing trends, you’ll find that market volatility and trade timing are essential. In forex, the higher liquidity and 24-hour trading lead to more pronounced fluctuations, affecting how you interpret and trade signals.
Can Algorithmic Trading Detect the Hanging Man Pattern Effectively?
Yes, you can effectively detect this pattern through algorithmic trading by leveraging advanced pattern recognition techniques.
These algorithms excel in identifying specific formations with high accuracy, even in volatile markets.
However, it’s important to fine-tune algorithmic adjustments to take into consideration market nuances between different trading environments.
What Are Alternative Patterns to Consider if the Hanging Man Fails?
If you’re exploring alternative candlestick patterns when one indicator fails, consider the Bearish Engulfing and Shooting Star patterns. Both signal potential market downturns.
The Bearish Engulfing pattern occurs when a large black candle fully engulfs the previous day’s smaller white candle, indicating a shift from buyers to sellers.
The Shooting Star, appearing after an uptrend, features a short body with a long upper shadow, suggesting a selling pressure that could precede a price drop.
Conclusion
This pattern, marked by a short body and a long lower shadow, signals potential reversals. When you spot it, ensure you look for confirmation of a reversal.
