You’ll find that mastering the combination of moving averages with MACD, RSI, and Bollinger Bands isn’t as intimidating as it might seem. While each indicator holds value on its own, their real power emerges when they work together to validate trading decisions.
These technical tools can confirm trend strength, identify momentum shifts, and reveal potential market reversals that might go unnoticed when using a single indicator. As you explore this powerful approach, you’ll see why some traders rely on this specific combination to build their most profitable strategies.
Have you downloaded your FREE 50 EMA Strategy yet? You should do it now.
tLDR
- Use moving averages to establish trend direction while MACD confirms momentum through signal line crossovers and histogram analysis.
- Monitor RSI overbought/oversold levels alongside moving average crossovers to validate potential entry and exit points.
- Look for price touching Bollinger Bands while crossing significant moving averages to confirm strong breakout opportunities.
- Combine golden crosses with positive MACD divergence and RSI readings above 50 for robust bullish signals.
- Watch for multiple indicator convergence when price crosses moving averages, accompanied by supportive RSI and MACD readings.
Understanding Moving Average
Before diving into complex technical analysis combinations, you’ll need a solid grasp of moving averages as they form the backbone of many trading indicators. These essential tools help you identify trends and filter out market noise by calculating average prices over specific time periods.
There are three main types of moving averages you’ll encounter:
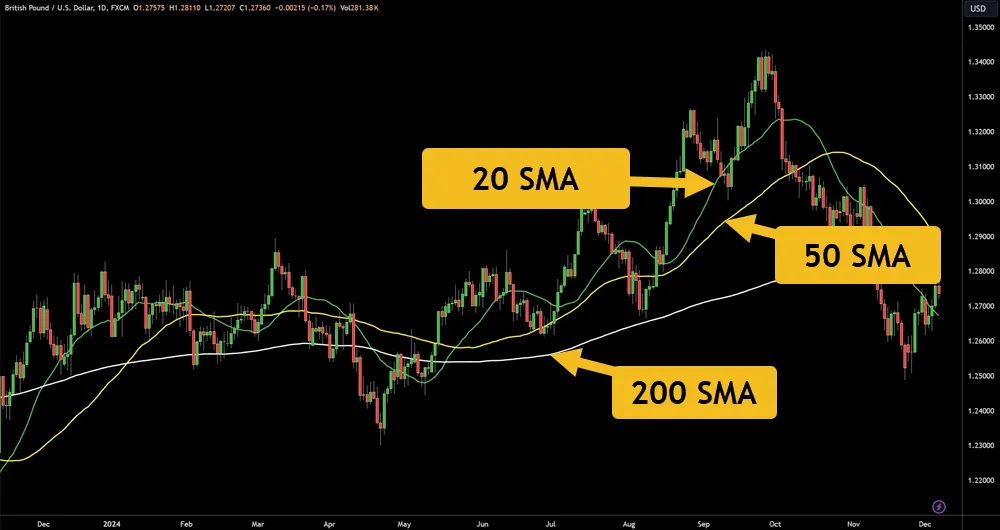
- Simple moving averages (SMA): Calculate the straightforward average of prices, giving equal weight to all data points
- Exponential moving averages (EMA): Place more emphasis on recent prices, making them more responsive to current market conditions
- Weighted moving averages (WMA): Assign different weights to data points, typically giving more importance to recent prices
When you’re looking at charts, you’ll notice that moving averages seem to act as dynamic support and resistance levels. For instance, the widely-used 200-day moving average often serves as a long-term trend indicator, while shorter periods like the 20-day and 50-day moving averages help identify medium-term trends. The trend alignment strategy requires analyzing multiple timeframes to confirm the market direction.
You can stack multiple moving averages to create a comprehensive view – when shorter-term averages cross above longer-term ones, it’s called a “golden cross,” potentially signaling bullish momentum.
The 20-period EMA provides an optimal balance between speed and reliability for traders seeking to make decisions on daily timeframes.
MACD Signal Confirmation Strategies
Building on your moving average knowledge, the Moving Average Convergence Divergence (MACD) offers powerful confirmation signals when combined with traditional MAs.
When you’re analyzing trends, look for MACD divergence signals that align with your moving average crossovers to strengthen your trading decisions.
Key Confirmation Strategies:
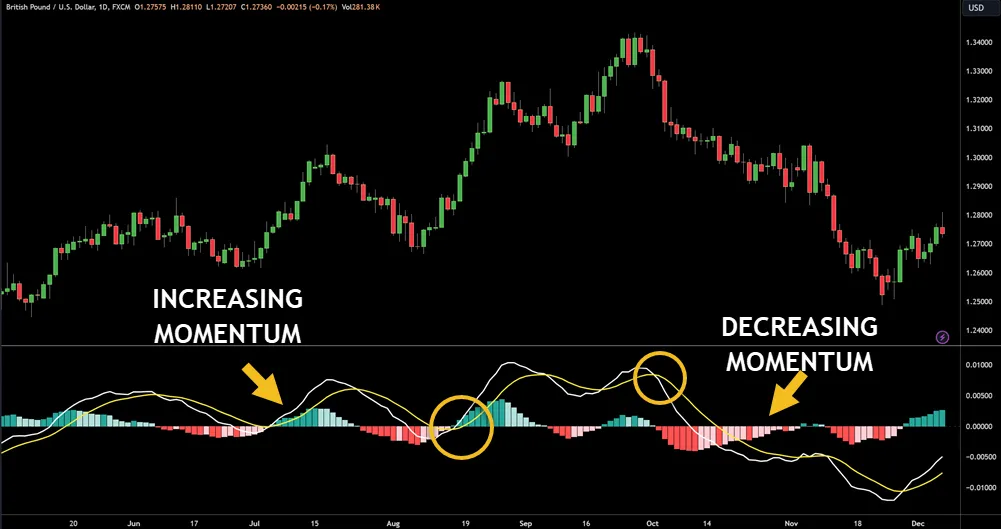
- Wait for the MACD line to cross above its signal line while price breaks above a key moving average
- Monitor histogram analysis for increasing momentum – larger bars suggest stronger trends
- Watch for bullish divergence when price makes lower lows but MACD makes higher lows
You’ll find the most reliable signals when the 200-day MA trend direction matches your MACD readings.
For example, if price is above the 200-day MA and you spot a bullish MACD crossover, you’ve got a high-probability setup.
Price action trading can enhance your MACD strategy by confirming market movements through historical patterns.
Want to refine your entries further? Add these timing elements:
- Confirm the histogram is expanding in your trade direction
- Check that price hasn’t moved too far from its moving averages
- Ensure the MACD lines aren’t extremely overextended
Using larger time frames for MACD analysis can help reduce market noise and provide clearer trading signals.
RSI Momentum
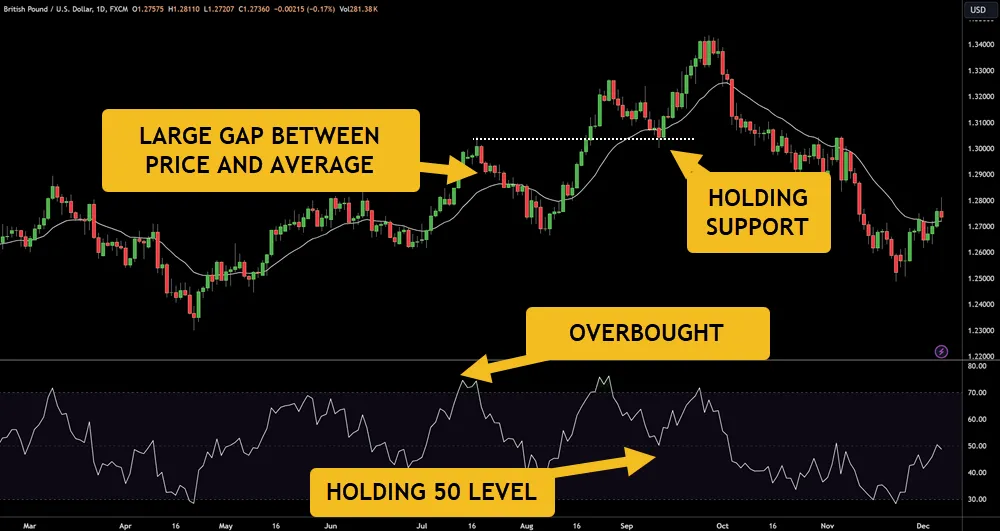
After establishing your moving average and MACD signals, integrating the Relative Strength Index (RSI) adds another layer of momentum confirmation to your analysis. You’ll want to focus on two key aspects: RSI divergence analysis and identifying overbought conditions to strengthen your trading decisions.
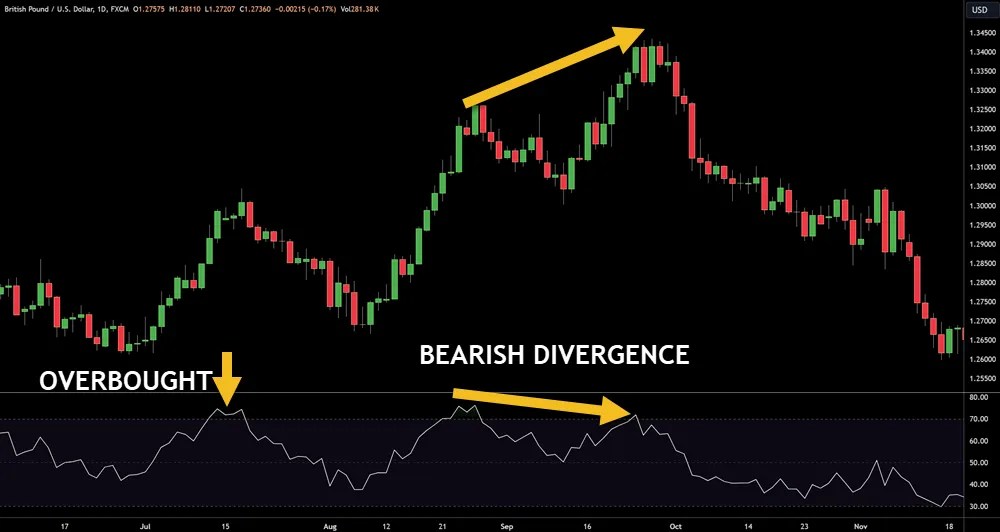
When you’re examining RSI divergence, look for situations where price makes new highs while RSI shows lower highs, or vice versa. This divergence often signals potential trend reversals and works particularly well when aligned with your moving average crossovers. For example, if you spot bearish RSI divergence while price sits above the 70 mark, and your MACD shows weakening momentum, you’ve got a solid sell signal.
J. Welles Wilder introduced this powerful momentum indicator in 1978 to help traders identify market reversals more effectively.
Here’s how to integrate RSI effectively:
- Monitor RSI overbought conditions (above 70) and oversold levels (below 30).
- Compare RSI readings with price action during strong trends.
- Wait for RSI to cross below 70 before selling in uptrends.
- Look for RSI to cross above 30 before buying in downtrends.
- Confirm signals with your moving average and MACD indicators.
Bollinger Bands Trading Applications
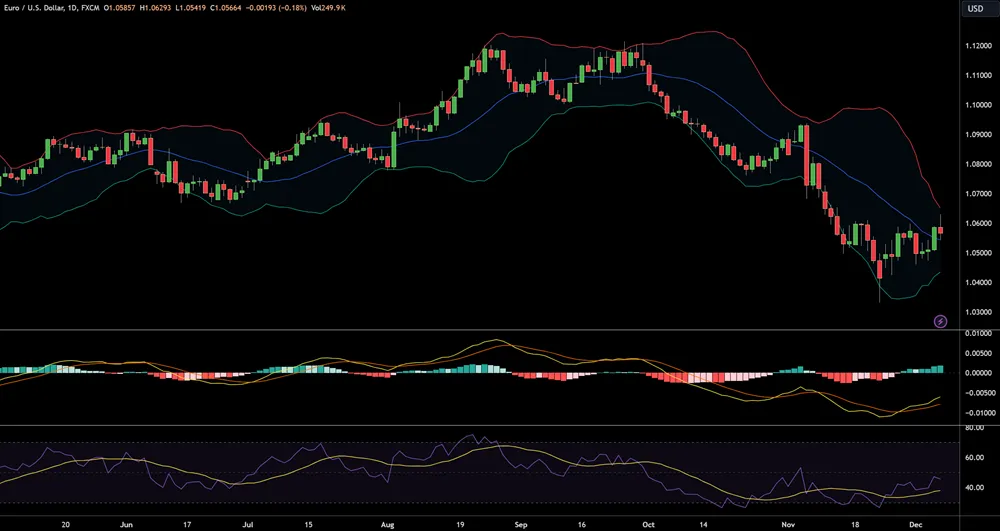
The integration of Bollinger Bands with your existing indicators provides powerful volatility-based trading signals. When you combine these bands with price action analysis, you’ll be able to identify potential Bollinger Band Squeeze setups, which often precede significant market moves. You can spot these squeezes when the bands contract, indicating decreased volatility and an impending breakout.
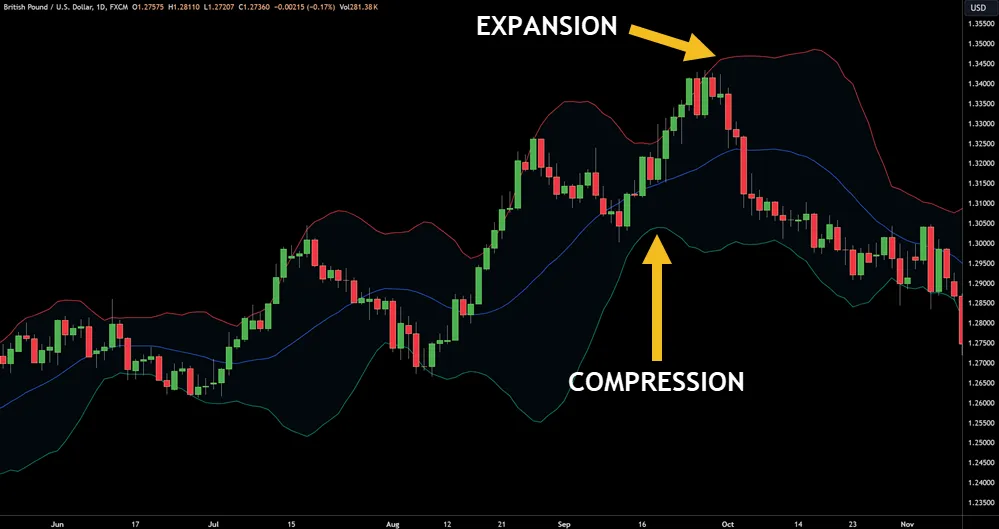
To use Breakout Strategies, monitor when price breaks above the upper band or below the lower band, particularly when this aligns with your other indicators. The bands act as Dynamic Support and resistance levels, helping you determine ideal entry and exit points.
Through Volatility Assessment, you’ll see that wider bands suggest higher market volatility, while narrower bands indicate consolidation periods.
For the most reliable signals, make sure to do some Historical Backtesting across different Timeframe Analysis periods. Watch for Trend Reversals when price touches either band and rebounds – this often signals a potential trend change, especially if confirmed by your moving averages.
Remember to adjust your band settings (typically 20-period SMA with 2 standard deviations) based on your trading style and timeframe preferences.
Multi-Indicator Entry Points
Strategic entry points emerge when multiple technical indicators align to confirm trading signals. You’ll want to look for signal convergence across different indicators to strengthen your trading decisions and reduce false signals. When your MACD, RSI, and Bollinger Bands all point in the same direction, you’ve got a more reliable setup.
Here’s how to validate your entry signals:
- Check if price crosses a moving average while RSI shows oversold/overbought conditions
- Confirm trend validation with MACD crossing above/below its signal line
- Look for price touching Bollinger Bands during volatility assessment
Market confirmation becomes stronger when you see multiple indicators supporting your analysis. For example, if you spot bullish divergence analysis on RSI while price touches the lower Bollinger Band and MACD shows positive momentum, you’ve got a high-probability setup.
Remember that waiting for 2-3 indicators to align might mean missing some trades, but it’ll help you avoid many false signals.
The key is patience – don’t jump at every single indicator movement. Wait for clear signal convergence before committing to a trade.
Risk Management With Combined Indicators
While combining multiple indicators strengthens entry signals, proper risk management remains at the core of successful trading. You’ll need to balance your position sizing with volatility assessment to ensure you’re not overexposed during turbulent market conditions.
When you’re using multiple indicators, it’s important to establish clear loss limits and maintain strict drawdown control.
Here’s how you can manage risk effectively when trading with combined indicators:
- Set your position size based on the combined volatility readings from Bollinger Bands and RSI – never risk more than 1-2% of your account on a single trade.
- Establish a minimum risk-reward ratio of 1:2 before entering any trade, using MACD and moving averages to confirm potential profit targets.
- Implement trade diversification by avoiding multiple positions in correlated markets when your indicators show similar signals.
- Create a drawdown limit that automatically reduces your position size by 50% when you’ve lost 5% of your account value.
Remember to adjust your risk parameters when indicators show conflicting signals, as these scenarios often lead to increased market uncertainty.
Your Questions Answered
How Do Market Holidays Affect the Calculation of Combined Technical Indicators?
Market holidays will affect your technical indicators since there’s no trading volume during these periods.
You’ll notice gaps in your calculations, which can skew moving averages and momentum indicators.
When developing your trading strategies, you’ll need to account for these gaps by either excluding holiday dates or adjusting your calculations to bridge these periods.
Remember that post-holiday sessions often show unusual price movements and volume patterns.
Can These Indicator Combinations Work Effectively in Cryptocurrency Markets?
You’ll find these technical indicator combinations can work well in crypto markets, but you’ll need to adjust for higher indicator sensitivity due to 24/7 trading and increased volatility.
While traditional trend confirmation patterns apply, consider using shorter timeframes and tighter parameters for your indicators.
Remember that crypto’s younger market history and higher price swings mean you should test your strategies thoroughly before committing significant capital.
Which Charting Software Best Displays All These Indicators Simultaneously?
TradingView stands out as your best option, with its user interface designed to handle multiple technical indicators seamlessly.
You’ll find its charting features particularly suited for displaying MACD, RSI, and Bollinger Bands simultaneously, while its customizable layout lets you stack or overlay indicators without cluttering your charts.
MetaTrader 4/5 and NinjaTrader also offer solid multi-indicator displays, but they’re less intuitive for beginners.
What Timeframes Show the Strongest Correlation Between These Combined Indicators?
You’ll find the strongest correlations when using multiple timeframes together: 15-minute charts for short-term strategies, and daily charts for long-term trends.
It’s best to start with the daily timeframe to identify the primary trend, then drill down to 4-hour and 1-hour charts for entry points.
For day trading, combine 5-minute and 15-minute charts to catch precise movements while keeping the bigger picture in focus.
How Do Stock Splits Impact the Accuracy of These Indicator Combinations?
When a stock splits, you’ll need to make indicator adjustments to maintain accuracy in your trading strategies.
Most modern charting platforms automatically adjust historical performance data, but you should verify this for your specific tools.
The good news is that technical indicators typically self-correct after a few trading sessions post-split.
Just remember to review your indicator settings and backtest your strategy after any split occurs.