The Gartley Pattern Forex Trading Strategy is based on a pattern called the Gartley pattern.
If you’ve never heard of the Gartley pattern, don’t worry, I will explain a bit of that in here.
You may also like to know that there also exists a gartley pattern indicator mt4 which you can download and upload it on your mt4 charts.
[toc]
What Is The Gartley Pattern?
- The Gartley Pattern is a chart pattern that is is based on fibonacci numbers or ratios.
- the gartley pattern is a retracement and continuation pattern which happens when a trend reverses temporarily before continuing in the original direction.
- the gartley pattern gives low risk entry setups when the pattern completes and price starts reversing.
What Does A Bullish Gartley Pattern Look Like?
This chart below is the ideal case for a Bullish Gartley pattern.
I know…it looks really confusing. But look closely…it looks like an “M” shape, doesn’t it?
Well, if you can think of a bullish gartely pattern as chart pattern that looks like letter M but with the slightly lower shoulder on the right side that it would make it even much more easier for you to see this pattern form on your charts.
I’m going to break it down step by step so you understand what each of the parts and numbers on the bullish gartley pattern below mean:

Let’s go through each of the parts of the Bullish Gartley Pattern:
See those little pink dotted lines, up there? Those indicate the Fibonacci retracmenent levels/ratios. For example, you can see that on the X-D pink dotted line, there’s a number that is written which is 0.786. This simply means that D point is the 78.6 % fibonacci retracment level of of price move from X-A.
Once you understand this, it makes it much easier for you to easily understand others.
For example, point C can be a 38.2% or 88.6% Fibonacci retracement level of the distance price traveled from B-C.
Starting to make sense now or not yet? If not, read very slowly….then you will understand.
Now, lets get into the details of each leg (A leg here refers to the points price moved, for example, when price moves from point X to A, then that is called an X-A leg).
X-A:
- this is the longest leg of the pattern when price moves up from point X to A
A-B:
- this is when price changes direction and moved down from point A to B.
- This A-B movement makes 61.8% Fibonacci Retracement of the X-A leg.
- The A-B leg must NEVER go past point X, if it does so, it is invalid.
B-C:
- notice that price changed direction here and moves up but does not go past point A.
- That up move should be anywhere from 32.8% to 88.6% Fibonacci retracement of the A-B leg.
C-D:
- this is the final leg of the bullish gartley pattern an it is the really important one because this is where you buy when the pattern is complete.
- point D is the 78.6% fibonacci retracment level of the X-A leg.
- or point D can also be the 127% or 161.8% fibonacci extension of the B-C leg.
On a real chart, the bullish gartley pattern looks more like this:

This chart below shows show the same bullish gartley pattern above but this time with fibonacci extensions and retracments drawn:

What Does A Bearish Gartley Pattern Look Like?
As you can see below, the bearish gartley pattern is the opposite of the bullish gartley pattern.

X-A:
- this is the longest leg of the pattern when price moves down from point X to A
A-B:
- this is when price changes direction and moves up from point A to B.
- First pullback at point B must be 61.8% of X-A leg.
- The A-B leg must NEVER go past point X, if it does so, it is invalid.
B-C:
- Point C can be 38.2% to 88.6% Fibonacci retracement of the A-B leg.
C-D:
- point D is the 78.6% fibonacci retracment level of the X-A leg.
- D can also be the 127% or 161.8% fibonacci extension of the B-C leg.
Here’s another chart of bearish gartley pattern with a bit more explanation as well:

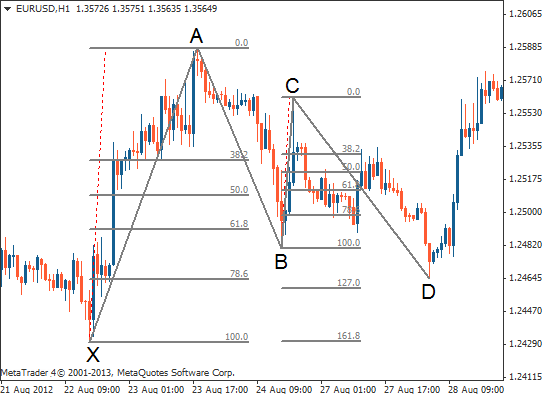
Here’s what a bearich gartley pattern would look like on your chart:

Here’s another example of Bearish Gartely Pattern:

How To Trade The Gartley Pattern (The Gartley Pattern Forex Trading Strategy)
You would have figured it out already from the above information where to trade the Gartley Pattern…its at point D.
You look to buy or sell at point D of the Gartley pattern.
Remember, point D=78% fibonaicci retracement of the X-A leg but all these other “legs” have to form first before point C forms.
Buy Setup On The Bullish Gartley Pattern
- Point D forms
- Look for a bullish reversal candlestick pattern. Top 10 reversal candlestick patterns will help you out if unsure.
- Place a buy stop pending order at lest 2 pips above the high of that bullish reversal candlestick
- Place stop loss 2-5 pips below the low of that bullish reversal candlestick if your pending order is activated or if that stop loss is too close, move a bit further and find the nearest swing low and place it just a few pips below it so you have less chance of getting stopped out prematurely.
- For take profit, you have two options, use point C or A, these two points are essentially previous swing highs.
Sell Setup On The Bullish Gartley Pattern
- Point D forms
- Look for a bearish reversal candlestick.
- Place a sell stop pending order at lest 2 pips below the low of that bearish reversal candlestick pattern.
- Place stop loss 2-5 pips above the high of that bearish reversal candlestick if your pending order is activated or if that stop loss is too close, move a bit further and find the nearest swing high point and place it just a few pips above it so you have less chance of getting stopped out prematurely in your trade.
- For take profit, you have two options, use point C or A, these two points are essentially previous swing lows.
Disadvantages of The Gartley Pattern Forex Trading System
- it can be a difficult concept to grasp for many forex traders because the gartley pattern has a handful of components that must be formed to make it a valid gartley pattern.
- a lot of intense technical analysis is involed using fibonacci tool and sometime it can also be a “guess” to identify which is the “X-A” or “A-B” leg etc
Advantages of The Gartley Pattern Forex Trading System
- if the gartely trade pattern setup proves correct and the trade goes as planned, the the risk to reward of this trading system is really great.
- you trade entry position on point “D” is a really good place to take a trade entry becasue if your analysis is right and price reverses from there as anticipated, it moves down or up fairly quickly giving you a lot of profitable pips quickly as well and this can allow you to move your stop loss to break-even to make the trade a risk free trade.
- it is price action trading really and what you can do is learn a lot more about forex reversal candlestick patterns to help you identify the best buy or sell signal at point “D”.

Hope you’ve learnt something about the Gartley pattern and the Gartely Forex Trading System and it would mean the world to me if you can share this with your friends and fans and don’t forget to mention or link to www.forextradingstrategies4u.com