You’re about to discover one of the most reliable swing trading strategies that successful traders don’t often discuss. When support becomes resistance or resistance becomes support, these “flips” create powerful opportunities for profits.
While most traders focus just on standard breakouts and breakdowns, you’ll gain an edge by understanding how to capitalize on these critical reversals. The psychology behind these flips, combined with proper timing and risk management, can transform your approach to market dynamics and help you spot high-probability setups that others miss.
TLDR
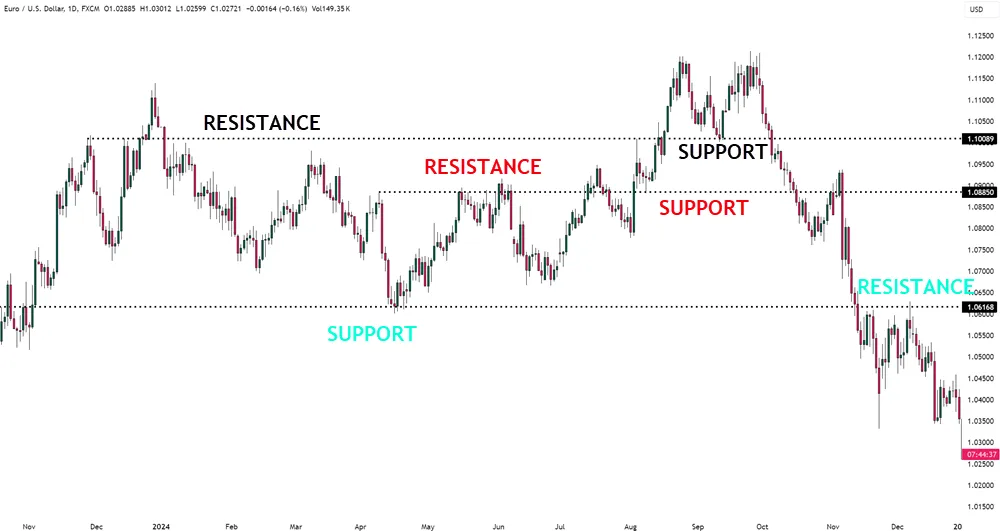
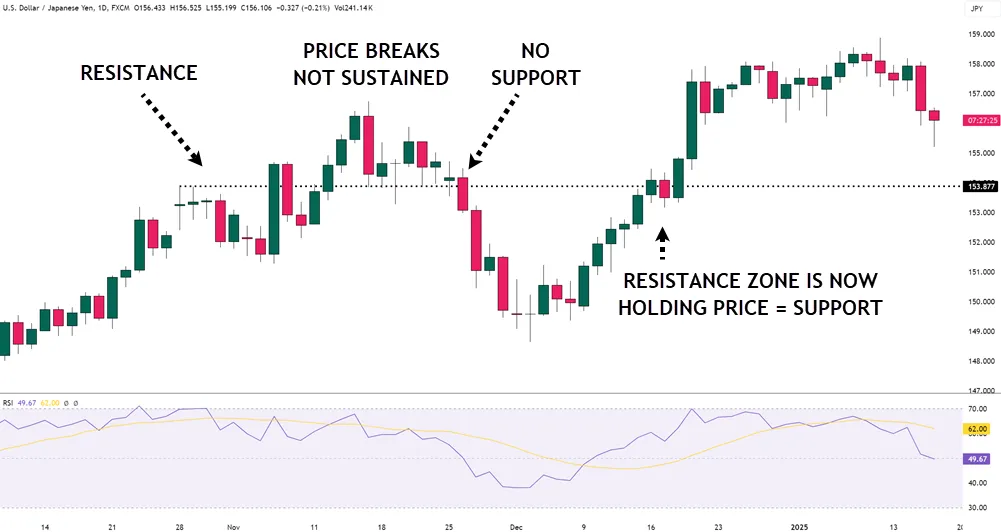
- When price breaks through support or resistance, these levels often reverse roles, creating new trading opportunities.
- Previous support becomes new resistance during downtrends, while previous resistance becomes new support during uptrends.
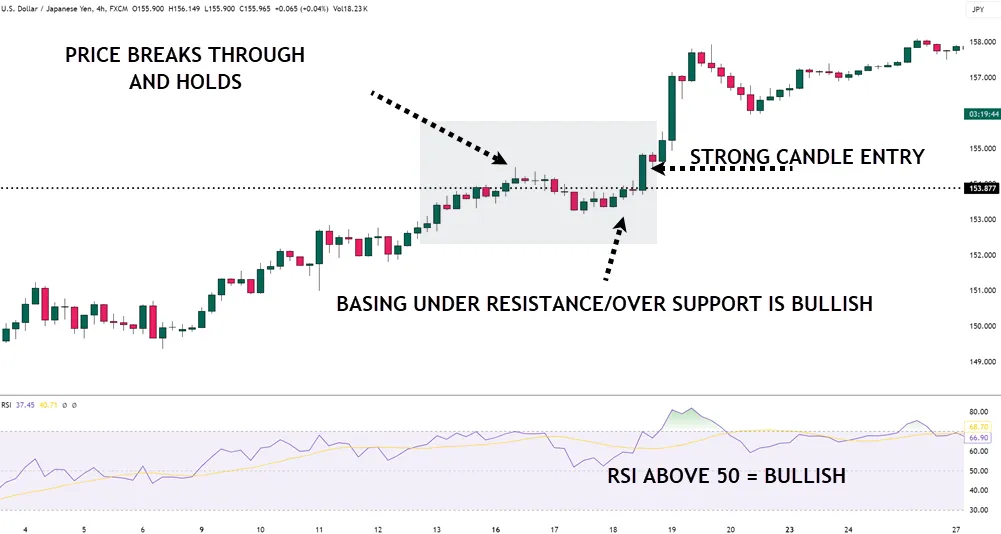
- Confirmation of flipped levels requires strong price action, increased volume, and multiple tests of the new level.
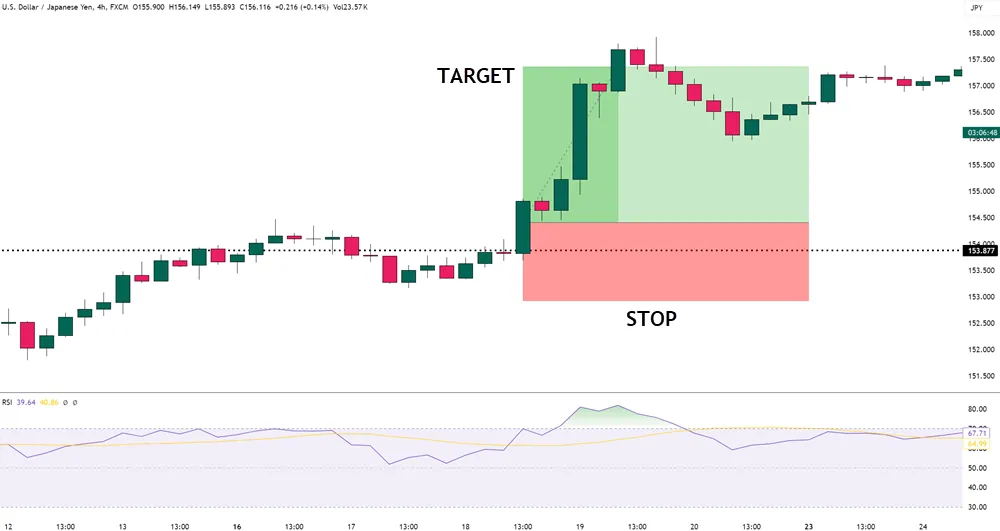
- Traders can enter positions after a successful retest of flipped levels, using candlestick patterns for precise timing.
- Stop losses should be placed beyond the flipped level, accounting for normal market volatility and false breakouts.
Support/Resistance Trading Strategy
Swing trading with support and resistance levels capitalizes on price action reversals at established technical barriers. This strategy looks to capture medium-term price movements by identifying key price levels where supply and demand create natural market turning points.
Traders use these levels to enter positions with favorable risk-reward ratios, typically holding trades for several days to weeks while price moves between support and resistance zones.
The 20-period EMA provides optimal balance between speed and reliability for identifying trend direction and potential reversal points.
| Indicator/Pattern | Purpose | Settings/Conditions |
|---|---|---|
| Support/Resistance Lines | Identify key price levels for potential reversals | Draw on major swing highs/lows, round numbers, and previous pivot points |
| Price Action Candles | Confirm breakouts and reversals | Look for engulfing patterns, pin bars, and other reversal candlesticks |
| RSI (Relative Strength Index) | Measure momentum and oversold/overbought conditions | 14-period setting; oversold below 30, overbought above 70 |
| Volume FX Futures | Validate breakouts and price movements | Compare current volume to 20-period average volume |
| Moving Averages | Identify trend direction and dynamic support/resistance | 20 and 50-period EMAs |
Trading Strategy Details
The strategy combines price action analysis with momentum indicators to identify high-probability trade setups at established support and resistance levels. This systematic approach helps traders avoid false breakouts and ensures trade entries have strong technical confirmation.
- Identify major support and resistance levels on daily timeframe
- Monitor price action as it approaches these levels. I prefer 4 hour or 1 hour on flips.
- Look for confirmation signals:
- Reversal candlestick patterns at support/resistance
- RSI showing oversold/overbought conditions
- Volume spike on potential breakouts (Monitor FX Futures)
- Price respect of moving averages
- Enter trades:
- Long positions: When price bounces off support with confirmation
- Short positions: When price rejects resistance with confirmation
- Set profit targets at next major support/resistance level
- Hold positions until:
- Price reaches target
- Technical signals show trend reversal
- Stop-loss triggered
Risk Management
Position size should not risk more than 1-2% of trading capital per trade. Set stop-losses below support for long positions and above resistance for short positions, accounting for normal market volatility. Use a minimum 1:2 risk-reward ratio, preferably 1:3 or higher.
Adjust position sizes in high volatility periods by:
- Reducing trade size by 50%
- Widening stops to accommodate larger price swings
- Taking partial profits at predetermined levels
- Using trailing stops after reaching 1R profit
Scale out of positions in trending markets by:
- Taking 50% profit at first target
- Moving stop to breakeven
- Letting remainder run to second target
- Adding to winning positions only after confirmation
Strategy Tips
Building upon the established trading strategy, several key tips can improve your execution and your success rate. When you’re identifying support and resistance levels, you’ll want to focus on the daily charts where price action leaves the clearest footprints of institutional activity.
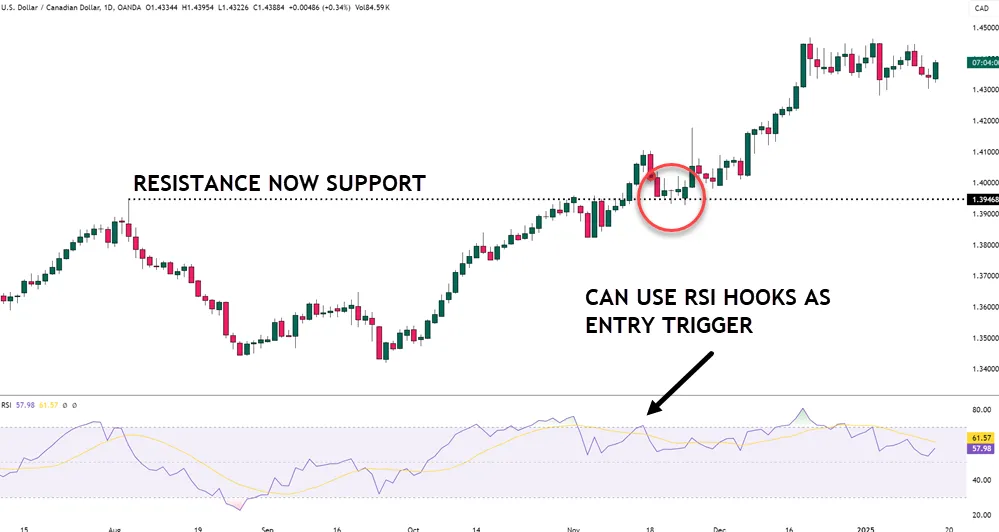
You’ll find your most reliable entry points when you spot weak retests of broken levels, especially if they’re accompanied by a pin bar signal or other confirming price patterns. I’ve found that waiting for clear momentum in the anticipated direction, rather than jumping in at the first touch of a level, improves trade outcomes in my swing trading strategy.
Remember to pay attention to key support and resistance zones that have been tested multiple times, as these areas often provide the most predictable reactions. When you’re using these trading strategies, you’ll want to look for clean price action setups that align with the overall market structure.
Don’t forget about your risk management – it’s absolutely vital to place your stop loss at logical technical levels. I always ensure my risk-to-reward ratio is at minimum 2:1 before entering any trade, measuring from the entry to both my stop loss and target levels.
When you spot inside bars or pin bars forming at these levels, they often provide great confirmation for your trade setup, but only take the trade if all your criteria align perfectly.
Pay close attention to interest rate decisions as they can trigger significant market volatility and create new support and resistance levels.
Strategy Pros And Cons
When trading support and resistance levels in swing trading, the flipping of these key levels provides valuable understanding into market dynamics. Successful identification of flipped levels can significantly improve trading decisions by offering clearer entry and exit points, while also providing stronger validation of trend changes.
This improved clarity helps traders better position themselves within the broader market trend and improves their ability to manage risk effectively.
However, traders must be cautious when applying this strategy, especially in volatile market conditions where price action can become erratic. The effectiveness of flipped support and resistance levels depends heavily on proper market testing and confirmation, as premature entries based on unconfirmed flips can lead to losses.
Understanding both the advantages and limitations of this approach is important for implementing it successfully in a swing trading strategy.
Positives:
- Provides clear and decisive entry/exit signals through confirmed level flips.
- Offers strong validation through market retests of flipped levels.
- Aligns trading positions with dominant market trends.
Negatives:
- Can generate false signals in highly volatile markets.
- Requires patience for proper level confirmation.
- May miss opportunities while waiting for clear flip validation.
Using trailing stops behind price swings can help protect profits when trading flipped support and resistance levels.
Final Tips
To maximize your success in swing trading support and resistance levels, mastering a few habits can make all the difference. You’ll want to develop patience when waiting for clear breakouts, as rushing into trades too early can lead to unnecessary losses. I’ve found that monitoring price action signals, like pin bars and inside bars, helps confirm the validity of these breaks.
When you’re analyzing trading ranges, pay close attention to how price behaves at historical swing points. These levels often become important reference points for future support and resistance, and they’ll help you anticipate market trends. You should also watch for weak retests of broken levels, as they’re typically excellent entry points for your trades.
Remember that market dynamics are constantly evolving, so you’ll need to stay flexible with your analysis of key levels. I recommend maintaining a detailed record of significant support and resistance zones, updating them as momentum shifts occur.
While it’s tempting to stick rigidly to predetermined levels, you’ll find more success by adapting to changing conditions and adjusting your strategy accordingly.
Focus on developing a systematic approach to identifying and confirming level breaks before committing to trades. You can improve your success rate by combining multiple confirmations, such as momentum indicators and price action signals, at these critical junctures.
Don’t forget that patience in waiting for proper setups often separates successful swing traders from those who struggle with consistency.
Consider incorporating Fibonacci retracement analysis to identify additional potential support and resistance levels that align with your existing trade setups.
Your Questions Answered
Is Support and Resistance Good for Swing Trading?
Support and resistance levels are highly effective for your swing trading strategy.
You’ll benefit from using these price action indicators to identify potential entry strategies and trading signals.
When you combine trend analysis with pattern recognition, you’ll better understand market psychology at key levels.
What Is the 1% Rule in Swing Trading?
The 1% rule limits your risk management to just 1% of your total trading capital per trade.
When you’re setting entry points and loss limits, you’ll ensure you’re never risking more than this amount, which helps maintain emotional discipline. This approach lets you withstand market psychology shifts while using technical indicators and chart patterns effectively.
You’ll find it easier to execute trades confidently, analyze trends, and set realistic profit targets while protecting your capital.
What Is a Support Resistance Flip?
A support resistance flip occurs when a price level switches its role in the market.
You’ll see this when a former support level breaks down and becomes a new resistance level, or vice versa.
It’s driven by market psychology, where traders’ collective behavior creates these powerful trading signals.
You can use these flips to identify trend reversals, plan your entry points, and develop exit strategies while managing risk through clear chart patterns.
What Is the Most Successful Swing Trading Strategy?
You’ll find the most successful swing trading strategy combines multiple elements: analyzing chart patterns for clear market trends, waiting for strong entry signals at key price levels, and implementing strict risk management rules.
Focus on high-probability setups by confirming your trade ideas with volume analysis and proper timeframes selection.
Remember to backtest your strategies thoroughly, maintain disciplined trade psychology, and always plan your exit strategies before entering positions.