In this weeks Forex and crypto setup update, I mentioned that I also trade weekly charts and this prompted the question of “why”.
Keep in mind that I don’t post weekly charts (although in the future I may) but I do trade them because there are often setups that are cleaner.
We know that if you trade a lower time frame and can’t decipher what is going on with price, bumping up to a higher time frame cleans it us a bit.
That applies to any chart from a 5 minute chart to a daily, weekly, monthly.
Take the EURUSD for example.

The daily chart is more of a ranging environment and these are often difficult trades to take. You can certainly trade from resistance to support and back again but there are issues with that.
- Range expansion can take you out
- Support and resistance levels are not always clear cut
- Failed breakouts can kick you out of your position at the exact time you should be entering
There are ways to trade ranges – I just don’t do it. I prefer a cleaner environment.
The EURUSD daily chart is not a great example of a clean setup.
Weekly Forex Chart
Going to the weekly chart, we have a better indication of what is going on with price.
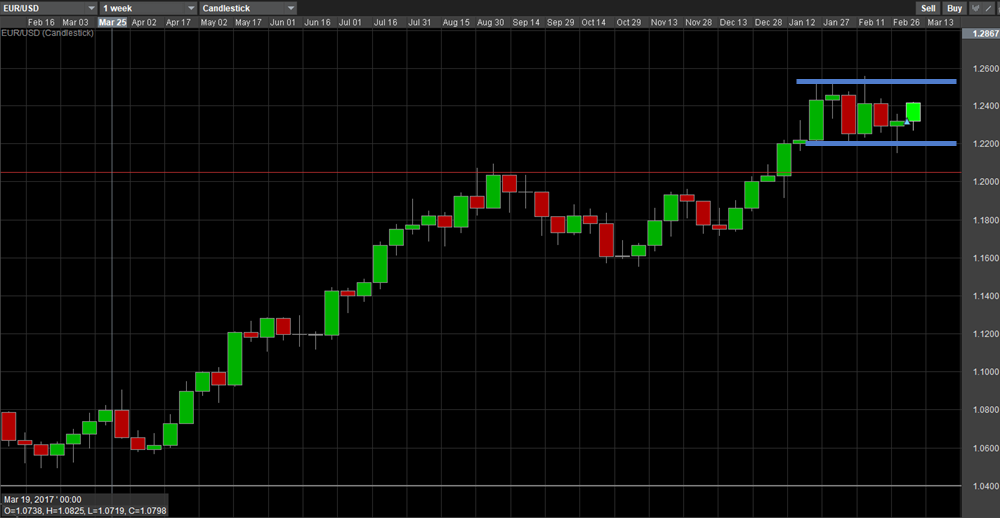
Price is consolidating at highs which, over a large sample set of trades, resolves back to the upside.
You can see how cleaner this price structure looks which gives you a better view of what price is doing.
Notice at the bottom of the consolidation, there is a test of lows and price trades back inside. This is the failure test of lows we look for in our setups as an entry technique.
You can see the little triangle on the right of that candlestick which is my trade entry. The red line is the current stop location.
I am not trading any pattern on the daily.
The trade opportunity is off the weekly pattern and the stop is based off the weekly pattern.
Trading Lesson
If you are going through your charts and can’t decipher what the chart is telling you, you have two options:
- Ignore that particular chart
- Head up to a higher time frame for a cleaner view of price
Everything else stays the same. From price patterns to how to enter and stop placement, nothing changes regardless of which time frame we use.
