The symmetrical triangle chart pattern is mostly considered a continuation chart pattern that forms in the shape of a triangle.
Checkout also: ascending triangle chart pattern forex trading strategy & descending triangle chart pattern forex trading strategy.
What this means is this chart pattern can form in a bull market or a bear market. Although symmetrical triangles are generally regarded as a continuation pattern in the direction of a long-term trend, they can mark the end of the current trend as a reversal pattern given the right context.

There are a few different types of triangle chart patterns in technical analysis and one way to think of them to avoid confusion is that are simply consolidation patterns or price compression patterns.
Defining Characteristics Of This Triangle Chart Pattern:
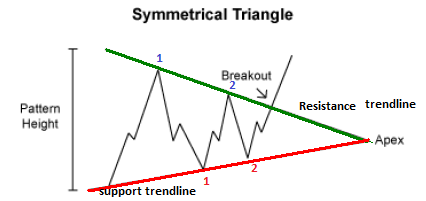
- There needs to be two points at the top that will from a resistance level using a trend line. Two points at the bottom will form the support level.
- The lines will converge into what is called the apex. Price will form higher lows and lower highs in the case of an uptrend as price narrows in range.
- If you are trading a market other than Forex where you can measure volume, expect to see declining volume within this chart pattern.
- The rule of thumb is in an uptrend, expect to see a break out of resistance.
- In a down trend, expect a support level break
- We NEVER know for certain which way it will break so you need confirmation of an actual break before trading it.
- Important rule: Fading the break when price is close to the apex is often times a losing play. While it may be a false breakout, the odds are a break with momentum will continue in the direction of the break.
The symmetrical triangle chart pattern forex trading strategy is also a price action trading strategy which means you really don’t need to use any indicators at all with it, but just the ability to recognize the chart pattern when its forming and then take trades on it.
Keys To Trading The Symmetrical Triangle Pattern
These are the two important things you need to be able to trade the symmetrical triangle chart patterns successfully:
- Triangle formation can happen anyplace on the chart but look for a momentum thrust in the direction of the trend as your first “on alert” signal.
- If you see in an uptrend for example a lower high and higher low form, start looking for the second point so you may draw a trend line.
- Profit target can be a measured move; take the largest zone of the triangle and project it from the area of the break near the apex to give you a price target for profit taking.
Sample Trading Strategy for Symmetrical Triangles
As with any price action and price structure trading, there is some subjectivity to it as two traders may see a different chart pattern.
What you must have though is a rigid trading plan which is not subjective and you can use this sample plan and amend as you see fit.
- Wait and watch for a candlestick to breakout of the triangle pattern on any time frame although higher time frames have better results. This candlestick must then close outside the descending or ascending trend line.
- Once this candlestick closes, depending on which side the candlestick closes, you either place a buy stop/sell stop order 2-5 pips from the closing price of that candlestick.
- Set your take profit target equal to the “pattern height.”(refer to chart above for pattern height, if you don’t know)
Setting your stop loss order is very important and you have a few options in that regard:
- If you placed a buy stop order, place your stop loss anywhere from 10-30 pips (this depends on what time frame you are using to get into this trade) under the low of the candlestick that broke out of the triangle chart formation OR…you can place your stop loss on the other side of the triangle chart formation…that is if you were to take a sell trade, where you could have placed your sell stop order then this is where you place your stop loss. Stop loss placement on this area is quite effective as you would have less chance of being stopped out prematurely.
- You can place is at halfway point between the descending and ascending trend lines just right where the breakout happens.
- If you place a sell stop order, place your stop loss 10-30 pips above the high of the candlestick that broke the triangle pattern.

TRADE MANAGEMENT
- when your trade is in profit and is halfway towards hitting its profit target, you can move stop loss break even to minimize your risk
- or you can take half of the profits and leave the other half running which is known as trailing your stop.
- also continue to lock your profits by moving your stop loss and trailing it behind higher swing lows as price moves upwards to your profit target(this is for a buy order). Do the opposite for sell order: move stop loss for each lower peak that forms until your take profit is hit.
ADVANTAGES OF THE SYMMETRICAL TRIANGLE PATTERN FOREX TRADING STRATEGY
- the symmetrical chart pattern is usually a very explosive breakout chart pattern. if you catch the breakout at the right time, profits come fast.
- its based on price action and there is really no need to add any other indicators so you should learn to keep it simple as it is without complicating it too much.
- the symmetrical chart pattern happens in all time frames, so regardless of what time frames you are trading, they do happen frequently especially in the much smaller time frames like the 1 min to the 30 minute time frames.
Updated 2017