
Trading the trend in any market is a great trading strategy and using the Parabolic SAR to find reversal points in the direction of the Forex trend makes it even better.
We are going to use the 100 period exponential moving average to show us the trend.
This is a longer period moving average than most people are used to considering the 20 period moving average is the most popular.
For day traders, you could swap out the 100 EMA for the 20 period moving average or even the 10 period MA.
Why Use The Parabolic SAR In A Trading Strategy
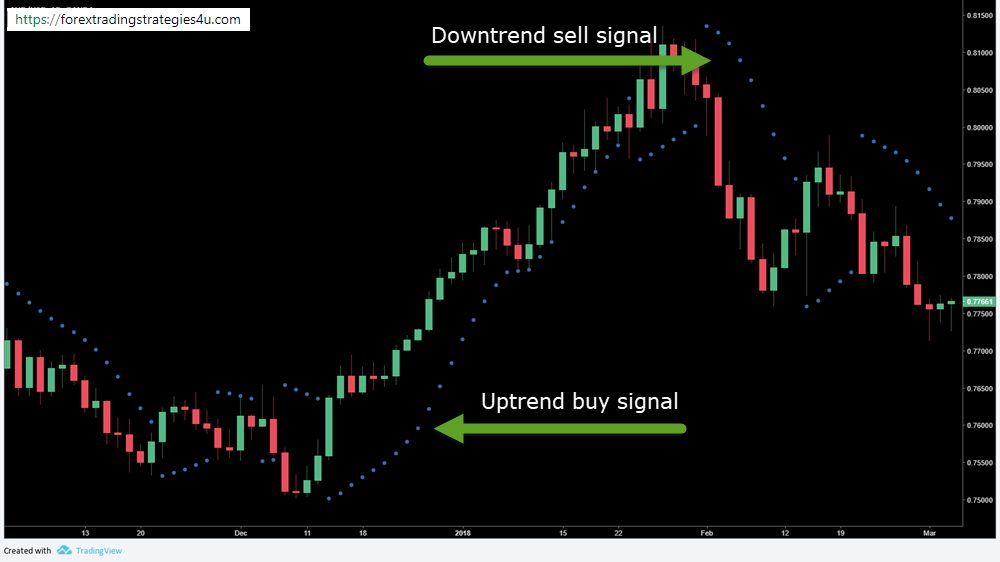
J. Welles Wilder invented this trading indicator and the Parabolic SAR stands for “stop and reverse”. In an uptrend, dots form under the price until price reaches a certain point when it flips to the top of price giving you a sell signal.
This is where the Parabolic SAR gets the “stop and reverse indicator” name from. Seeing as Parabolic SAR is a trend following indicator, the “flip” from bottom to top would indicated that longs should close their trading position and then sell the market they are trading.
For Forex traders, that simply means that the quote currency, the second currency in a Forex pair, has gained some strength.
Any trading strategy that uses the Parabolic SAR has a built in trailing stop function. As price declines for example, the dots will decline as well and seeing as “stop and reverse” is the main feature, you can use the dots as a stop out location.
As with any trading indicator you are using for a strategy, you can make Parabolic SAR move sensitive by adjusting the increment setting. I use the default parameters as over optimizing a trading indicator to make past data look better, is a rookie mistake.
We are going to use the Parabolic SAR to give us both buy signals and sell signals but we will not stop and reverse our trading position.
Using The Moving Average With Parabolic SAR
Using the 100 period exponential moving average will gives us the opportunity to stay inside of the major trend direction while taking only the signals that fall in line with the current trend.
If you were to take every flip of the Parabolic SAR as a trading signal, you could find yourself entering and exiting positions quickly for a loss in a whipsaw market condition. Any trend following indicator is prone to fail in a market that is not trending. Since markets only trend about 35% of the time, you can see a filter will help you stay out of low probability trading conditions.
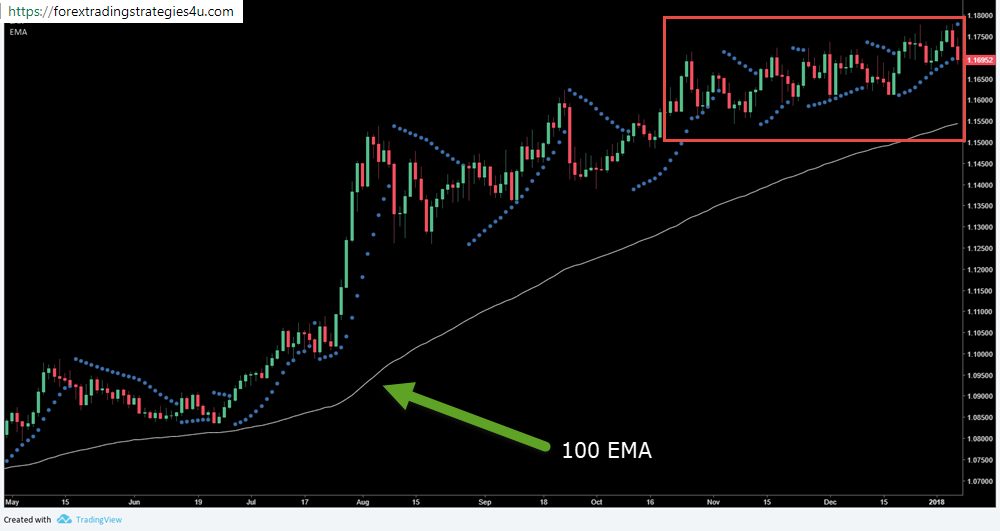
Using the 100 moving average will help keep us in line with the larger trend and prevent over trading. Taking a look at the red box, you can see price action is showing consolidation and the Parabolic SAR is flipping back and forth giving buy and sell signals.
It would have been tough trading just taking the buy signals (look closely as some were profitable) even though there was a probability of a larger up move due to the overall trend direction. Taking sell signals as well would have chopped your Forex trading account to pieces.
Parabolic SAR Trading System Rules
Every trading strategy needs rules and the number one rule we will have for the Parabolic SAR strategy that we will use for swing trading is:
trade only in the direction of the 100 EMA.
Our rules beyond that are quite simple. Complex trading rules can lead to you not following the trading plan you have written which leads to a failed trading business. All successful traders follow a written trading plan and I suggest you do as well.
Buy Signals (just reverse for sell signals)
- We need price to trade above the 100 period moving average. If price is whipping around the EMA, we will choose another market
- The Parabolic SAR must print a dot beneath a candlestick and that will be our buy signal
- Place a buy stop order so momentum on the break of the setup candlestick high will take you into the market
- Use a few pips below the printed dot for your initial stop loss location
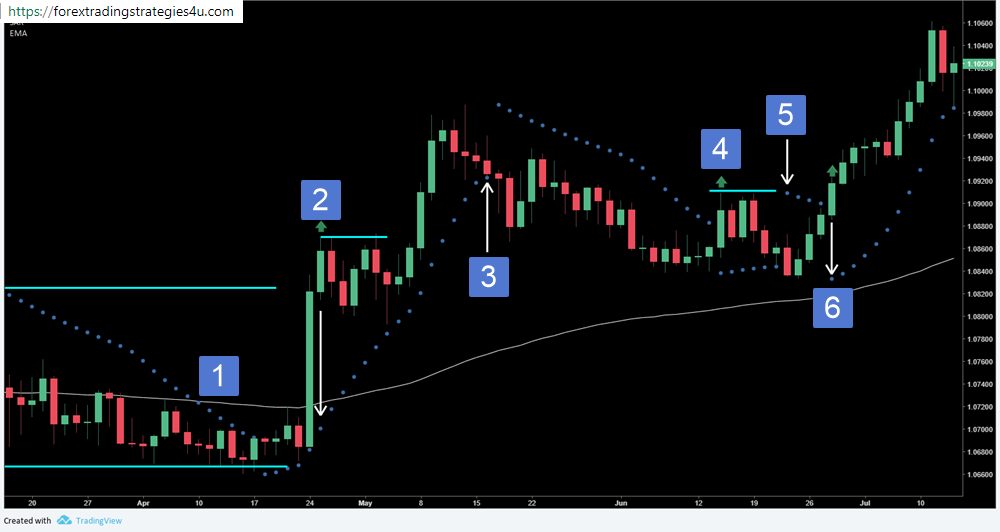
Let’s break this chart down to see how the Parabolic SAR signals worked out in relation to the uptrend given by the 100 EMA.
- Notice price is whipping around and close to the 100 EMA. The two blue lines are the support and resistance levels of a range that has formed due to consolidating price action. We need to wait until price moves from the moving average before considering any Parabolic SAR trading signals.
- Large momentum move and price action and price structure traders can see price is actually sitting on the former resistance level of the range. The white line is the buy signals with the small arrow indicating where you’d place a pending order.
- This is where the stop and reverse nature of the Parabolic SAR comes in. We would exit our long position and not take the sell signal due to the trend.
- Buy signal occurs when the blue dots appear below the candlestick. We don’t get triggered in the trade due to placing a pending order a few pips from the high of the setup candlestick.
- A sell signal is given which cancels the long setup.
- Another buy signal is given and price takes off to the upside
Stop Loss Location
The white arrows are showing where the stop loss would be on these trades when triggered. You can see that it is a fairly large stop which would require a smaller position size.
The trades did not trigger at the setup candlestick and as the blue dots climbed upwards while the trade order was still pending, you could alter your stop loss to be in line with the new plotted dots.
Traders who understand price action including pullbacks and breakouts, could use the dots as a potential trading setup.
Alternative Parabolic SAR Trading Strategy
Let’s look at the same chart but with a different trading persepctive
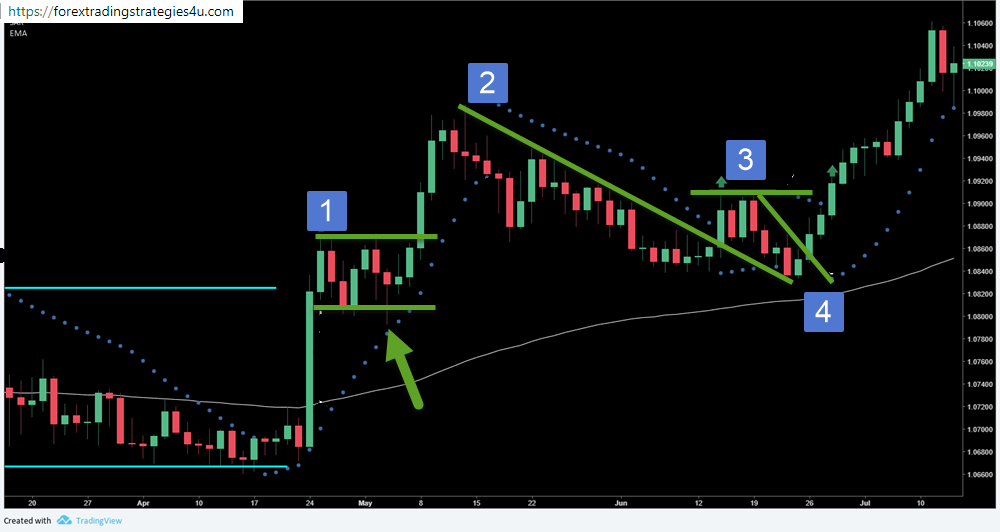
Using a more price action approach, is there a way we can combine the moving average trend direction with the Parabolic SAR buy and sell signals? Yes.
Let’s use the signals to alert us to a potential trading pattern.
- The buy signal brings us to the chart where we see momentum move and price consolidating at highs. I talk about this type of setup in my weekly Forex setup updates. We can play the breakout and use the corresponding blue dot for our stop. We can also use the candlestick shown by the green arrow. This is a failure test of lows where we can buy inside the range at the high of that candlesticks
- This sell signal alerts us to watch for a price action pattern. Here we get a pullback in price and without a blue dot switching to the bottom, we are not brought into a long trade when price has the little rally in the middle of the pullback
- Price breaks out of the trend line with a corresponding buy signal but does not go much further. Price pulls back and the sell signal cancels any trading play
- Price action shows a retest of the broken trend line (which we see happen a lot!) and then a break of the down trend line with a corresponding buy signal
You can see that combining price action trading along with trading in the direction of the trend and with the proper SAR signal, we can get some great trades in this Parabolic SAR strategy!