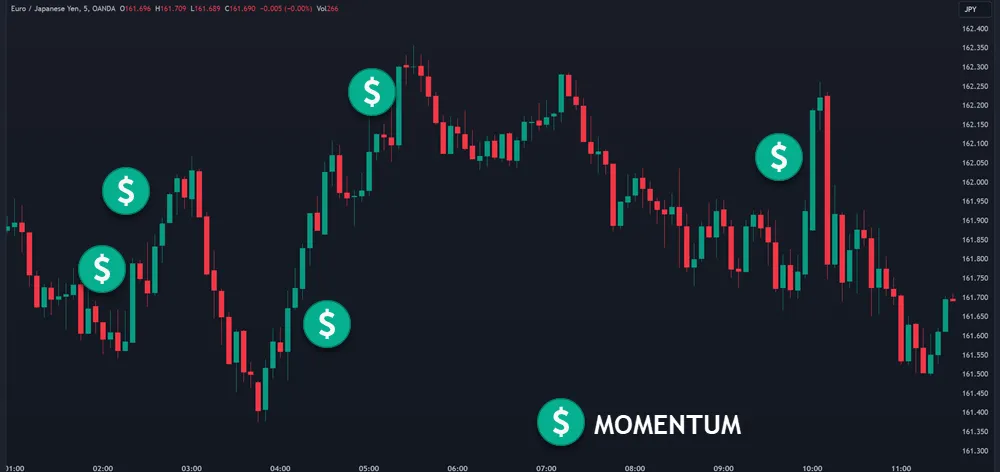
Intraday momentum strategies may be the trading approach you are looking for. This approach allows you to capitalize on short-term price movements within a single trading day, potentially leading to quick profits.
You’ll need to master technical analysis, understand market psychology, and develop pretty quick decision-making skills. While the rewards can be great, you need to recognize the risks involved.
Have You Grabbed Your FREE 50 Moving Average Strategy? Do It Now!
Intraday Momentum Trading in Forex
This approach involves identifying and acting on currency pair trends within a single trading day.
You’ll need to focus on technical analysis and momentum indicators to spot potential opportunities. Trend trading and breakout strategies are particularly useful for intraday momentum traders, as they help identify and capitalize on short-term market movements.
Your trading psychology plays a significant role, as you’ll be making quick decisions in response to market volatility. It’s essential to stay informed about news impact (FOMC releases, etc), as sudden events can affect currency values.
Proper risk management is vital to protect your capital, given the fast-paced nature of intraday trading. Execution speed is key, as you’ll need to enter and exit positions quickly to take advantage of short-term price movements.
Key Indicators for Intraday Momentum Trading
When you’re using intraday momentum trading in forex, you’ll rely on several key indicators to guide your decisions.
You’ll often use the MACD histogram to spot trends and momentum, while the RSI helps you gauge overbought or oversold conditions.
The Commodity Channel Index (CCI) is another valuable oscillator for identifying strong trends and potential entry or exit points in sideways markets.
Additionally, you’ll find moving averages and the Intraday Momentum Indicator (IMI) useful for generating trading signals and measuring short-term momentum shifts.
MACD Histogram: Trend and Momentum Indicator
One of the most powerful tools in an intraday momentum trader’s toolkit is the MACD Histogram. This indicator helps you spot trend changes and momentum shifts quickly.
To use it effectively, start by adjusting your MACD settings to suit your trading timeframe. For intraday trading, test out the following MACD setting: 5, 34, 21.
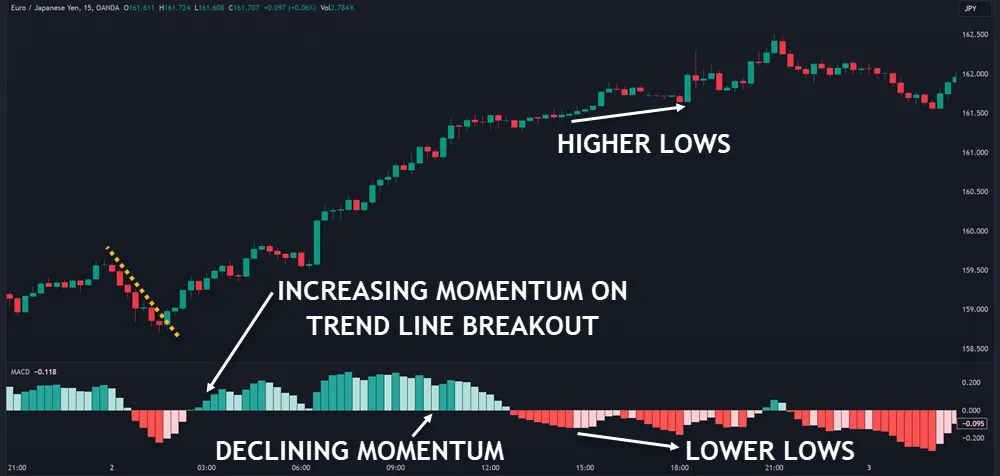
Then, focus on histogram analysis. Watch for divergence between the histogram and price action, as this can signal potential trend reversals.
For trend identification, pay attention to the histogram’s position relative to the zero line. When it’s above zero, the trend is likely bullish; below zero suggests a bearish trend.
Keep an eye out for momentum shifts, which are indicated by changes in the histogram’s height. As the bars grow taller, momentum increases; shrinking bars suggest weakening momentum. This insight can help you time your entries and exits more precisely.
Note that decreasing momentum may not result in a reversal. Price will often form a consolidation when momentum subsides.
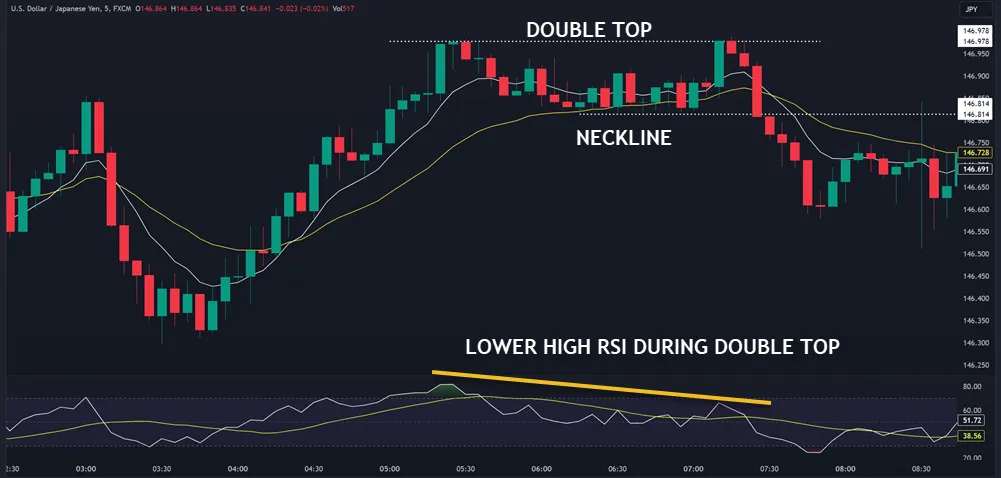
RSI: Overbought/Oversold Condition Gauge
The Relative Strength Index (RSI) is a cornerstone indicator for intraday momentum traders in the forex market. It’s a versatile oscillator that helps you gauge overbought or oversold conditions. You’ll typically find RSI levels between 0 and 100, with readings above 70 suggesting overbought conditions and below 30 indicating oversold.
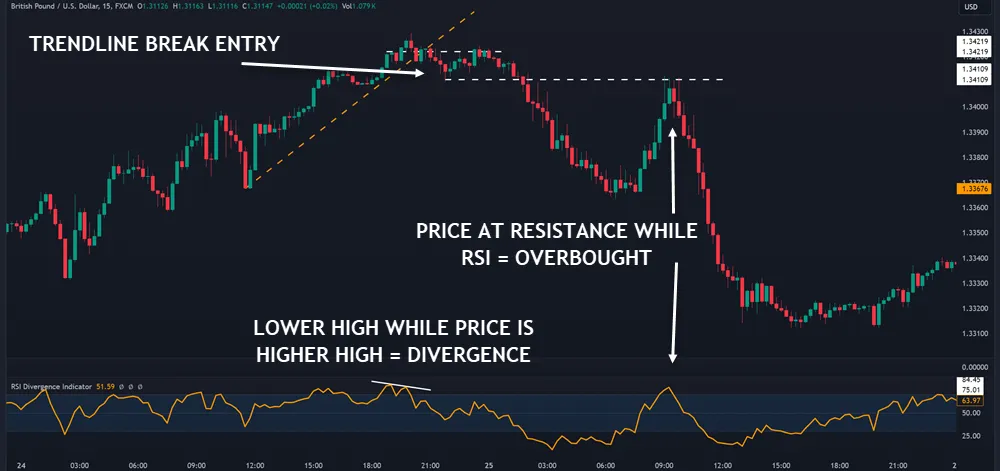
These levels often trigger trading strategies based on potential reversals. Understanding market psychology is crucial when using RSI. Divergence analysis can reveal hidden strengths or weaknesses in price movements.
You can customize oscillator settings to fit your trading style and you can start with the following setting for intraday trading: Period: 9-11 | Overbought level: 70-80 | Oversold level: 20-30.
Moving Averages: Fast-Slow Combo for Signals
Moving averages’ versatility makes them indispensable for intraday momentum traders in forex.
You’ll often use a combination of fast-moving and slow-moving averages to spot potential trade opportunities. Fast-moving averages react quickly to price changes, while slow-moving ones provide a broader market perspective.
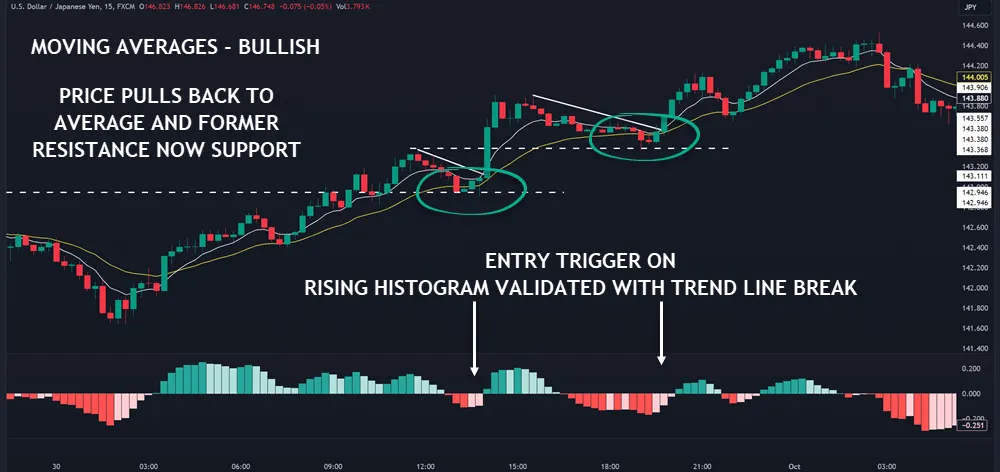
Crossover strategies are popular, where you’ll look for the fast average to cross above or below the slow one as a signal. These crossovers can indicate shifts in momentum and potential entry points. However, use moving averages alongside other indicators for signal confirmation.
Consider the following settings during your backtest: For intraday trading, a combination of fast and slow-moving averages is recommended:
- Fast MA: 5-period or 8-period EMA
- Slow MA: 13-period or 21-period EMA
This combination allows for quick reactions to price changes while providing a broader market perspective.
IMI: Candlestick-RSI Hybrid Momentum Indicator
Intraday Momentum Indicator (IMI) combines the power of candlestick analysis with the Relative Strength Index (RSI) to create a hybrid momentum tool. It’s designed to help you spot short-term trends and potential reversals in forex markets.
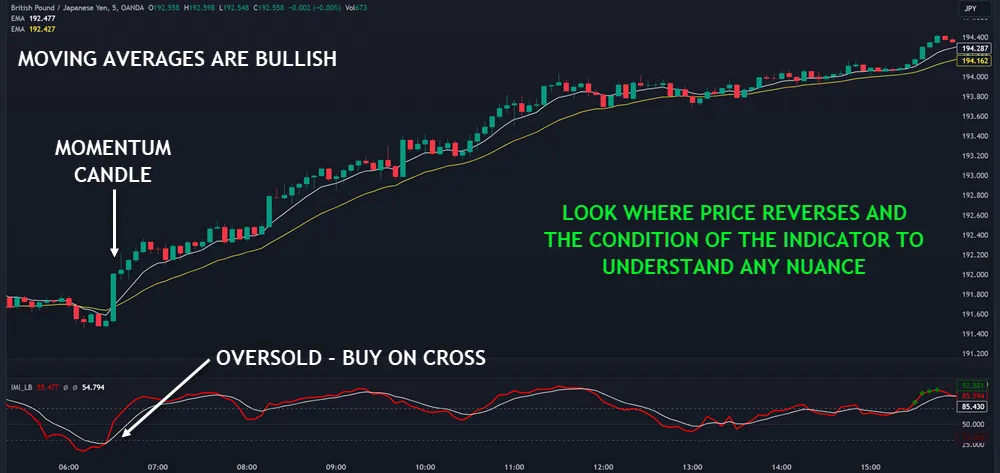
One of the main IMI advantages is its ability to filter out market noise, giving you clearer signals for entry and exit points.
However, IMI has limitations, such as potential lag in fast-moving markets. To use IMI effectively, you’ll need to develop specific IMI trading strategies. These might include combining IMI with other indicators or using it to confirm trend changes.
Consider testing these settings: Period: 14 (default setting) | Overbought level: 70 | Oversold level: 30
When backtesting IMI methods, focus on different timeframes and market conditions to assess its reliability. You’ll find that IMI asset performance can vary, so it’s crucial to test it on the specific currency pairs you plan to trade.
Best Timeframes for Forex Intraday Momentum Trading
When it comes to Ideal Timeframes, you’ll want to focus on shorter intervals that capture Market Volatility effectively.
| Timeframe | Chart Type | Trading Window | Notes |
|---|---|---|---|
| Short-term | 1-minute | 9:30 AM – 10:30 AM | Most volatile, potentially profitable |
| Short-term | 5-minute | 9:30 AM – 11:30 AM | Balanced between detail and noise |
| Short-term | 15-minute | 9:30 AM – 11:30 AM | Less noise, good for trend confirmation |
| Overall | All | 9:30 AM – 11:30 AM | Recommended concentration period |
You might want to concentrate your efforts between 9:30 AM and 11:30 AM for best results.
Technical analysis tools like moving averages and RSI can be particularly useful for identifying momentum shifts during these timeframes.
Keep in mind Session Overlaps, as these can provide increased trading opportunities. Liquidity Considerations are important too, so pay attention to times when major financial centers are active.
Identifying Entry and Exit Points in Momentum Trading
To identify potential entry and exit points in intraday momentum trading, you’ll want to focus on three key areas.
First, watch for breakouts where the price breaches important support or resistance levels, signaling a possible trend continuation. It’s important to confirm these breakouts using New York close charts to minimize the impact of intraday noise and ensure more reliable signals.
Next, learn to recognize common chart patterns like triangles, flags, or head and shoulders formations, which can indicate upcoming price movements.
Lastly, pay attention to momentum indicator signals, such as crossovers or divergences, which can help confirm trend strength or potential reversals.
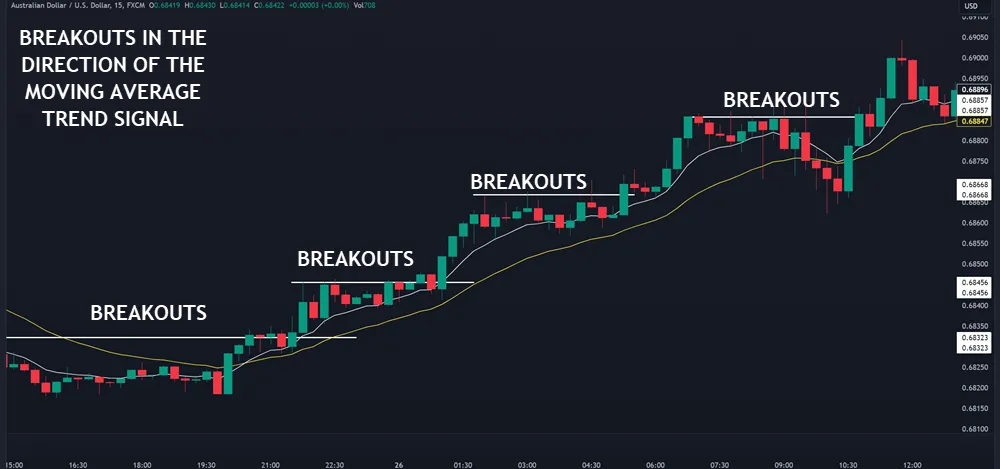
Breakouts: Price Breaches Support or Resistance
Breakout trading represents a cornerstone strategy in intraday momentum trading, particularly in the forex market. You’ll find that breakout strategies focus on identifying when price breaches support levels or resistance zones.
To effectively use this approach, you’ll need to:
- Watch for price action near established support and resistance areas
- Look for increased volume as the price approaches these levels
- Confirm the breakout with momentum indicators
Be cautious of false breakouts, which can trap inexperienced traders. True breakouts often lead to trend continuation, offering profitable opportunities.
You can enter trades when the price strongly breaks through a level, setting your stop loss just beyond the breakout point. As you gain experience, you’ll learn to distinguish between strong and weak breakouts.
Pattern Recognition: Identify Key Chart Formations
While breakouts offer one approach to momentum trading, pattern recognition provides another powerful tool for identifying potential entry and exit points.
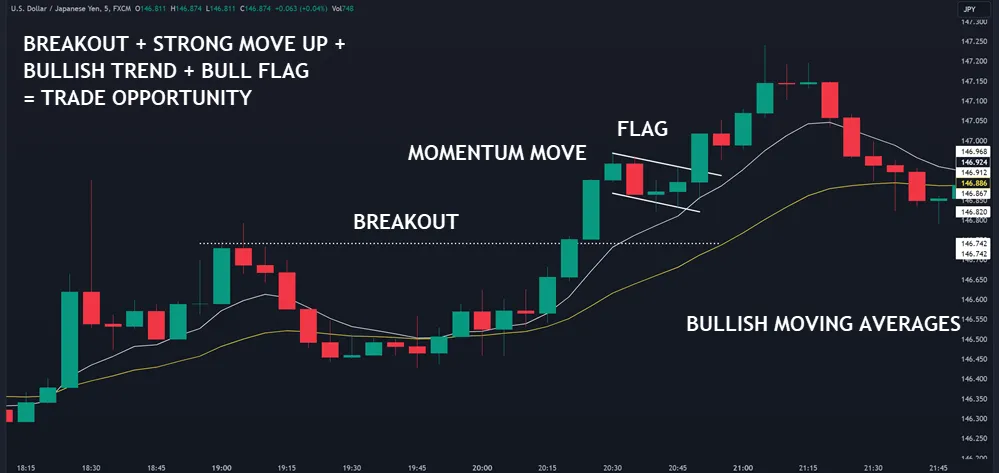
You’ll want to familiarize yourself with common chart patterns like head and shoulders, bull/bear flags double tops, and triangles. These formations can signal potential trend reversals or continuations.
Pay attention to trend lines, which help you spot the overall market direction. Look for reversal signals, such as candlestick patterns, that might indicate a change in momentum.
During consolidation phases, watch for signs of building pressure that could lead to a breakout. Combine these pattern recognition skills with your breakout strategies for a more comprehensive approach.
Remember, no pattern is perfect, so always use stop-loss orders to manage risk.
Indicator Signals: Momentum Crossovers and Divergences
When you’re looking at momentum indicators, focus on crossovers and divergences. These can help you spot potential trend reversals or continuations.
Here’s a quick overview of key indicators:
- Momentum indicators: Tools like RSI, MACD, and Stochastic Oscillator
- Crossover strategies: Watch for indicator lines crossing each other or a set level
- Divergence trading: Look for misalignment between price action and indicator movement
To interpret momentum shifts effectively, combine multiple signals. For example, you might use a MACD crossover along with an RSI divergence to confirm a trade setup.
Risks of Intraday Momentum Trading in Forex
Being involved in Intraday Momentum Trading in the Forex market can be a double-edged sword. While it offers potential profits, you’ll face several risks that require careful risk management and psychological discipline.
Your trading strategies must account for market volatility and incorporate fundamental analysis (focus on economic releases) to avoid false signals. Be aware that rapid price movements can lead to significant losses if you’re not vigilant. It’s easy to fall into the trap of overtrading, so maintain discipline and stick to your plan.
Effective risk management techniques are needed to safeguard your account during volatile intraday trading sessions. This includes proper position sizing and implementing stop losses to limit potential losses.
Remember, successful intraday trading demands constant market monitoring, which can be time-consuming. You’ll also need to factor in transaction costs, as frequent trading can eat into your profits.
Conclusion
Intraday momentum trading is fast-paced and requires quick thinking. Always use your indicators plus price action, stick to your chosen timeframes, and be execution perfect with your entry and exit points. Don’t forget the risks involved – they’re part of the game. With practice and discipline, you’ll refine your skills.