When you’re considering various trading timeframes, the hourly chart offers a sweet spot between the faster pace of day trading and the waiting periods of daily charts. You’ll find that hourly timeframes provide enough price action to identify meaningful patterns while filtering out the market noise that usually comes with the shorter intervals. This balance allows you to maintain your regular lifestyle without being glued to your screen, and still catch significant market movements.
TLDR
- Hourly charts provide multiple trading opportunities daily while maintaining a balanced pace for thoughtful decision-making.
- Clear pattern recognition and trend identification improve entry and exit points with reduced noise from minor fluctuations.
- Strategic time management allows traders to monitor markets effectively without constant screen time commitment.
- Reliable support and resistance levels on hourly charts enable precise stop-loss placement and better risk management.
- Independent analysis and reduced emotional stress help traders avoid herd mentality and develop confident trading strategies.
Key Benefits of Hourly Time Frame Trading
When you’re looking to optimize your trade execution, hourly charts provide the perfect balance between capturing significant market movements and filtering out unnecessary volatility.
Key Benefits of Hourly Trading:
- Improved Pattern Recognition: You’ll find that chart patterns become clearer on hourly timeframes, as they reduce the clutter seen in shorter intervals while preserving essential market structure.
- Time Management: Instead of being glued to your screen watching minute-by-minute changes, you can check your charts periodically during session overlaps and key market hours.
- Trend Identification: You’re able to spot intermediate trends more effectively, which helps align your trading strategies with the market’s broader direction.
The hourly timeframe also offers practical advantages for your trading routine. You’ll notice enhanced entry and exit points as you can analyze price action without the distraction of minor market fluctuations. Understanding statistical advantages in your chosen timeframe is needed for developing effective trading strategies.
During active FX trading sessions, you can identify support and resistance levels easier, leading to better-informed decisions.
Think of hourly charts as your market compass – they’re detailed enough to guide your immediate trading decisions but broad enough to keep you focused on significant price movements.
Unlike shorter timeframes that can create a casino-like environment, hourly charts help traders maintain emotional control and generally make better decisions.
Hourly vs. Longer Time Frames: Trade Frequency
The fundamental contrast between hourly and longer timeframes is in their trading rhythm and execution frequency. When you’re using hourly trading strategies, you’ll see more opportunities to execute trades, but you’ll need to master active monitoring techniques to handle the increased pace.
| Aspect | Hourly Charts | Daily/Weekly Charts |
|---|---|---|
| Trade Volume | Multiple setups daily | 2-3 setups monthly |
| Monitoring Need | Constant attention | Periodic checks |
| Signal Quality | More frequent, less reliable | Fewer, more reliable |
| Risk Management | Tighter stops needed | Wider stops possible |
Your market volatility assessment becomes needed when trading hourly timeframes, as you’ll need to process information quickly and manage false signals effectively. You’ll likely find 3-5 potential trades per day, compared to just a few quality setups per month on longer timeframes. This higher frequency requires you to:
- Develop a fast trade execution timing routine
- Implement strict false signals management protocols
- Maintain focused monitoring during trading hours
- Adjust position sizes for shorter holding periods
Remember that while hourly charts offer more trading opportunities, they do need more of your attention and quick decision-making skills. You’ll need to balance the increased frequency against the higher likelihood of market noise affecting your trades.
By mastering these elements, you can better handle the faster-paced environment of hourly trading while maintaining disciplined risk management. Implementing time stops during the first 90 minutes of trading can help optimize your hourly trading performance.
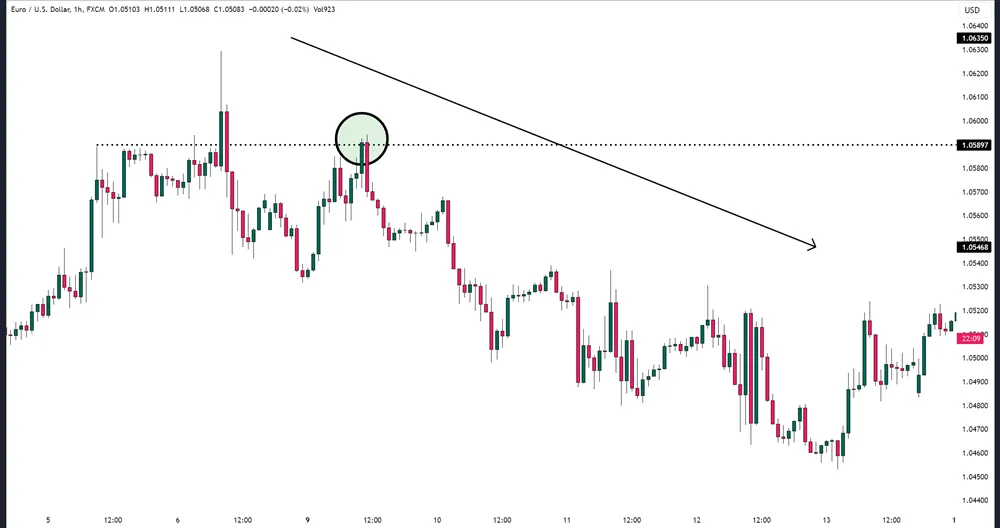
Identifying Trends and Reversals in Hourly Charts
Building on the fast-paced nature of hourly trading, understanding how these timeframes reveal trends and reversals becomes a key advantage. When you’re looking at hourly charts, you’ll find they strike the perfect balance between detailed price action and reduced market noise, making them ideal for spotting significant market moves.
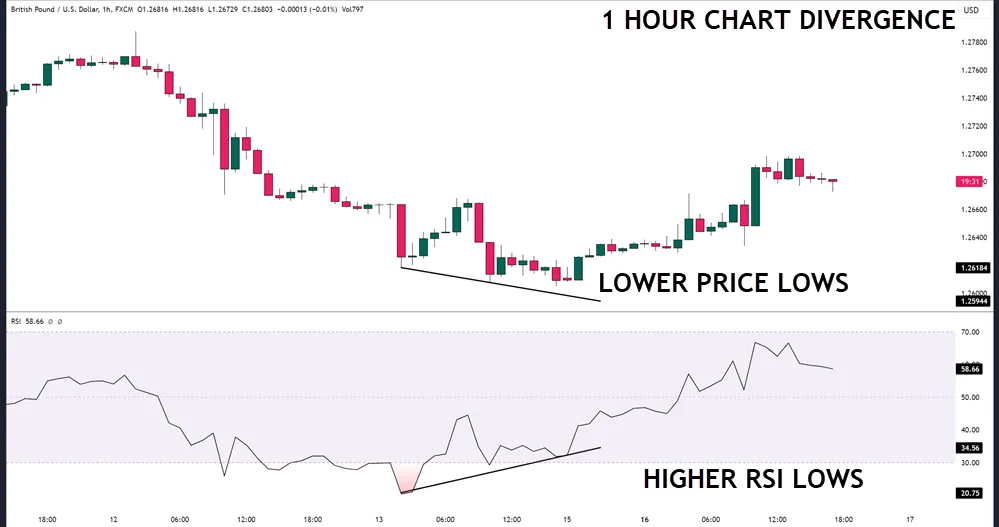
Your hourly chart patterns are more reliable indicators for potential trend changes. You’ll often spot formations like head and shoulders or triple tops that can signal upcoming reversals. Combined with technical indicator signals such as RSI divergences, these patterns help you make more informed trading decisions.
The beauty of trend strength analysis on hourly timeframes lies in its ability to confirm what you’re seeing on larger timeframes while filtering out unnecessary noise.
Here’s what makes hourly timeframes particularly effective for trend and reversal identification:
- They provide enough detail to spot developing trends without getting lost in minute-by-minute fluctuations
- You can easily identify price action strategies like pin bars and hammer patterns
- They work perfectly as part of a multi timeframe collaborative approach
- Technical indicators are more reliable due to balanced data points
- You’ll catch intermediate trend changes that might be missed on daily charts
Risk Management with Hourly Time Frames
You’ll see that hourly charts provide the perfect balance between detailed price action and meaningful market context, allowing you to make decisions about your risk assessment and position sizing.
| Risk Management Component | Hourly Time Frame Benefit |
|---|---|
| Stop Loss Placement | Identifies key support/resistance levels |
| Position Sizing | Helps calculate risk-per-trade ratios |
| Volatility Analysis | Shows intraday price movements clearly |
| Trade Coordination | Enables precise entry/exit timing |
| Risk Assessment | Reveals market condition changes |
When you’re using stop loss strategies, hourly charts help you spot price levels where you should place your protective orders. You can set these stops just below support in uptrends or above resistance in downtrends, giving your trades enough room to breathe while protecting your capital.
Your volatility analysis becomes more effective on hourly time frames, as you’ll clearly see how price movements evolve throughout the day.
This insight helps you adjust your position sizing accordingly – you might reduce your exposure during highly volatile periods (news release) or increase it when conditions are more stable.
Remember to coordinate your trades across different time frames. While your daily chart might show the overall trend, your hourly chart will reveal the best moments to execute your trades. By monitoring market conditions on hourly intervals, you’ll stay alert to potential risks without being glued to your screen constantly.
Psychological Benefits of Hourly Trading Strategies
Understanding hourly time frames not only helps with risk management but also offers significant psychological benefits for traders. When you trade on hourly charts, you’ll develop greater emotional resilience as the slower pace allows for more thoughtful, calculated decisions rather than rushed reactions.

The psychological advantages of hourly trading become evident in your decision making clarity and disciplined approach. You will see you are better equipped to analyze market conditions and execute trading strategies without the overwhelming stress that often accompanies shorter timeframes.
Here are the key psychological benefits you’ll experience:
- Reduced emotional stress due to fewer split-second decisions, allowing you to maintain composure during market fluctuations
- Improved focus and clearer market analysis without the noise typically found in shorter timeframes
- Enhanced discipline through structured trading opportunities and better adherence to predetermined rules
- Better risk management capabilities with time to evaluate stop-loss placements thoughtfully
- Increased opportunity for identifying and addressing psychological patterns in your trading behavior
The hourly timeframe is an ideal middle ground that helps you develop a more balanced trading mindset. You’ll have enough time to reflect on your decisions while still maintaining active market engagement.
This reflection period is important for developing your trading strategy and understanding your own psychological responses to market movements. By trading hourly charts, you’re giving yourself the mental space needed to grow as a trader while maintaining productivity.
Your Questions Answered
Which Trading Platforms Offer the Best Tools for Hourly Timeframe Analysis?
You’ll find excellent hourly analysis tools on TradingView, MT4, and ThinkOrSwim platforms, offering strong charting features, fast execution, mobile accessibility, active community forums, and user-friendly interfaces.
How Much Capital Is Recommended When Trading With Hourly Timeframes?
You’ll need $5,000-$10,000 as ideal capital for hourly trading, allowing proper risk management and trade sizing. Consider your account utilization carefully and maintain a balanced position strategy. Of course with FX, you can start with as low as $50.00
Can Hourly Timeframe Trading Be Combined With Fundamental Analysis Effectively?
You can effectively combine fundamental analysis with hourly timeframes by monitoring economic indicators, news releases, and market correlations while using technical analysis to pinpoint ideal entry and exit points.
What Are the Most Reliable Technical Indicators for Hourly Charts?
You’ll find moving averages, relative strength index (RSI), and trend lines most reliable on hourly charts. Support levels and classic chart patterns work well when confirmed by volume.
How Does Market Volatility Affect Hourly Timeframe Trading Strategies?
You’ll need to adjust your volatility strategies during high market behavior periods. Watch price patterns closely, maintain strict risk management, and control your trading psychology to avoid emotional decisions.