Hello Traders,
I’m going to rant a little bit about Fibonacci Trading, especially how to trade fibonacci retracement and fibonacci extensions.
But even better then knowing how to use fibonacci retracements and extensions for trading, this tool is also really good to use with price action confluence trading and I will also show you a few examples of how you can do that.
But first, if you are new to this fibonacci trading thing, you go to understand some definition of some fibonacci trading terms like:
- what is a fibonacci retracement
- what is a fibonacci extension
- what are the fibonacci retracement levels
- what are the fibonacci extension levels
Many traders do not know this but the concept of fibonacci retracement and fibonacci extension are based on support and resistance.
I will explain that in this article as well.
Let’s get started…but first here’s a bit of crash course about the history of the fibonacci numbers.
What Are The Fibonacci Retracement Levels?
Fibonacci Retracement levels are simply ratio used by traders to identify potential levels where price can reverse from.
To know more about this fibonacci ratios, you have to know what a fibonacci sequence is…( I know, this is boring!).
Fibonacci Sequence
- The Fibonacci Sequence is a series of numbers that seem to consistently occur in nature. This was discovered by a 13th century mathematician called Leonardo Fibonacci and hence the name.
- The method to calculate the sequence is to add any Fibonacci number together with the number that immediately precedes it in the sequence.
- Using this formula, and assuming the first two numbers are zero and one, you can calculate the first ten numbers in the Fibonacci Sequence as follows:
- 0 + 0 = 0
0 + 1 = 1
1 + 0 = 1
1 + 1 = 2
2 + 1 = 3
3 + 2 = 5
5 + 3 = 8
8 + 5 = 13
13 + 8 = 21
21 + 13 = 34Based on the above, there are the first 10 numbers in the fibonacci sequence: 0, 1, 1, 2, 3, 5, 8, 13, 21, 34.Now, the fibonacci seuqnce number are totally useless to a trader…what really matters to a trader are Fibonacci ratios.But having said that, you cannot get Fibonacci ratios without the Fibonacci sequence of numbers.
Fibonacci Ratios
- From the Fibonacci Sequence you get a series of ratios, and it is these ratios that are important to forex traders.
- The most important Fibonacci ratio is 61.8% – referred to as the “golden ratio” or “golden mean” simply because it tends to be the most reliable retracement ratio.
- The 61.8% ratio is calculated by dividing any number in the sequence by the number that immediately follows it. Here’s the interesting thing: regardless of the number you choose, the answer will always be very close to the mean average of 0.618, or 61.8%. Here are a few examples:
- 8 divided by 13 = 0.615 = 61.5%
- 13 divided by 21 = 0.619 = 61.9%
- 21 divided by 34 = 0.617 = 61.7%
- The other two Fibonacci Ratios also of special importance to forex traders are 38.2% and 23.6%. These two ratios seem to have a lower level of success, but are still included for technical analysis purposes.
- The 38.2% ratio is derived by dividing any number in the sequence by the number found two places to the right. For example:
-
- 8 divided by 21 = 0.380 = 38.0%
- 144 divided by 377 = 0.381 = 38.1%
- 6765 divided by 17,716 = 0.381 = 38.1%
- In the same manner, the 23.6% ratio consists of any number in the sequence divided by the number that is three places to the right:
- 5 divided by 21 = 0.238 = 23.8%
- 34 divided by 144 = 0.236 = 23.6%
- 6765 divided by 28,667 = 0.235 = 23.5%
- In addition to these three ratios, most trading strategies also show retracement levels at 50% and 100%. It is this series of ratios that are superimposed over a price chart in the form of Fibonacci Retracement Lines as indicated in the following price USDJPY chart example:

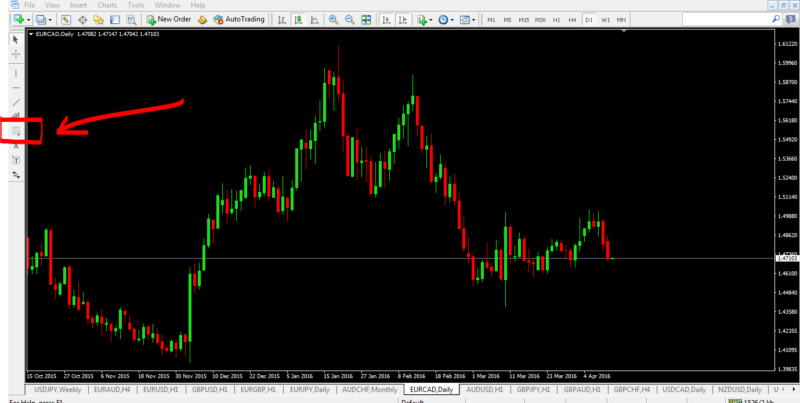
Fibonacci Retracement and Extension Tool In Mt4 Chart
If you are trading using the metatrader4 platform, then this is where you’ll get the fibonacci retracement and extension tool to do your technical analysis:
What Is A Fibonacci Retracement?
A fibonacci retracement is a simply a technical analysis method of finding support and resistance levels on your charts.
The use of fibonacci retracements and extensions works best in a trending market.
So in a downtrend market, fibonacci retracements can be used to find potential resistance levels.
In an uptrend market, fibonacci retracements can be used to find potential support levels.
Steps To Draw A Fibonacci Retracement In An Uptrend:
- Find the swing low (identified as 1 on the chart below)
- and find the swing high point (identified as 2 on the chart below)
- then click the fibonacci retracement/extension icon as shown above on the MT4 trading platform and first click on point 1 and drag to point 2.
That’s how you draw a fibonacci retracment levels in an uptrend so that you can anticipate where price will reverse up from…and in this case based on this chart below, you can see that price went down to the 50% fibonacci retracement level, found resistance there and then shot up.

In a a downtrend, you just do the exact opposite of what you did above:
- find a swing high pont (1)
- find a swing low point (2)
- then draw the fibonacci retracement by clicking first on point 1 and drag to point 2.
- then wait for price to go up to the fibonaaci retracement levels and see if it gets rejected down from there.
In the case of this chart below, price got rejected(found resistance) at the 50 % fibonacci level:

What Is A Fibonacci Extension?
So what is a fibonacci extension and how is it different from a fibonacci retracement?
A fibonacci extension is used to project or forecast into the future where price may likely hit resistance or support.
Fibonacci extension levels are drawn past the 100% level.
So what is the main use of Fibonacci extensions then?
Well, it is used by many forex traders to determine the price levels where they can set their profit targets.
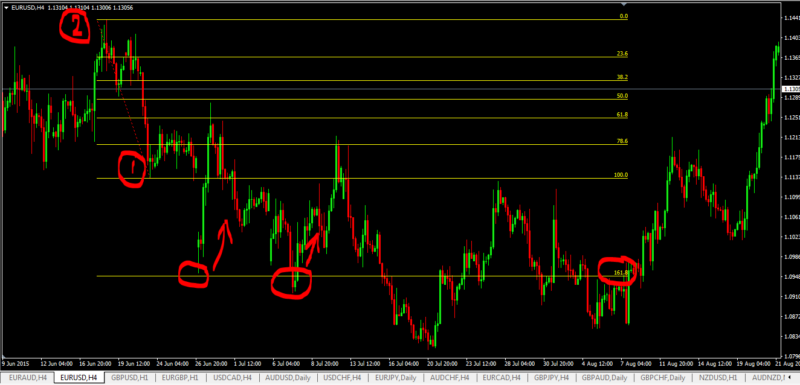
How To Draw A Fibonacci Extension In A Downtrend
We know that in a downtrend, prices do not keep falling all the time. There will be times when price will stop falling and bounce back up.
The price levels where price bouncing back up are effectively support levels.
And one way to anticipate this is for you to know how to draw a fibonacci extension in a downtrend to give you the heads up of the potential support level price may encounter.
It is a really simple process and here are the steps:
- identify the swing low point (1)
- identify the swing high point (2)
- click and drag fibonacci tool from point 1 to point 2.
- potential take profit target levels are 161.8% and 261.8% fib extension levels.
In this case, notice that price went down to 161.8% fibonacci extension level and bounced back up. Knowing such behavaviour, you can set your take profit targets on 161.8% level.
How To Draw A Fibonacci Extension In An Uptrend
Forex prices do not continue rising up all the time in an uptrend market.
There will be times when price are going to fall because they are going to hit a resitance level somehwere up.
Thats where drawing a fibonacci extension in an uptrend becomes handy as it one way (or a tool) that can help you identify potential resistance levels where price will hit and drop.
And this is hwere you can set your take profit targets.
So the process of drawing a fibonacci extension in an uptrend is simply to do the exact opposite of what you did above in a downtrend:
- identify the swing high point (1)
- identify the swing low point (2)
- click and drag fibonacci tool from point 1 to point 2.
- potential take profit levels are 161.8 and 261.8% fib extension levels.
As you can see on the chart below that price did indeed react to the 161.8 and 261.8 fibonacci levels.

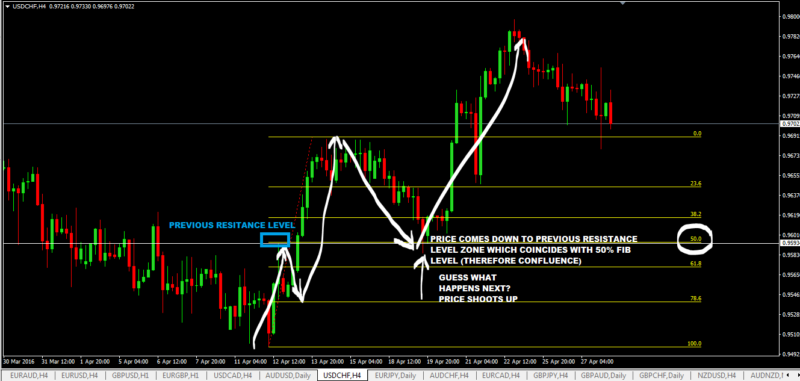
Examples of Price Action Confluence Trading With Fibonacci Retracements
Here are few chart examples giving you ideas of what to look for in a chart:

Here’s another example:
If you’ve enjoyed this article about fibonacci extensions and fibonacci retracements, please don’t forget to spread the word around to your fans and friends who are interested in forex trading. And thanks for visiting forextradingstrategies4u.com