Traders favor the Pin Bar Trading Strategy for its ability to signal potential market reversals. The distinctive shape of a pin bar candlestick makes it easily identifiable. This candlestick pattern suggests that despite initial strong price movement in one direction, the market ultimately closed in the opposite direction, indicating a possible shift in market sentiment.

A pin bar is a type of candlestick pattern that signals a potential reversal in the market. It is characterized by a long tail (a wick or shadow) and a small body. The tail represents a significant rejection of a price level, indicating that the market is likely to move in the opposite direction of the tail.
FREE REPORT: THE #1 Breakout Trading Plan…DOWNLOAD HERE
Where should you look to trade these pin bars?
Aim for areas where the price has previously shown it can either move up or fall—these are often called support and resistance levels.
I’ll walk you through a straightforward pin bar trading method but let’s first look at the characteristics of good pin bars.
Pin Bar Candlestick Characteristics
The Pin Bar candlestick is known for its distinctive look, with a long wick — like the tail of a pin — and a little body. Think of it as a clear sign that traders didn’t accept the price level in the currency pair you are trading. This pattern is pretty noticeable and different from other signs that prices might be about to change direction.
Components of a Pin Bar
- Tail (Wick or Shadow): The long tail shows the price level that was rejected. For a pin bar to be valid, the tail should be at least two-thirds the length of the entire candlestick.
- Body: The small body of the pin bar represents the difference between the opening and closing prices. It should be relatively small compared to the tail.
- Nose: The nose is the small part of the candlestick opposite the tail.
These pin bars are like a snapshot of a tug-of-war between buyers and sellers at a certain price point. When you see a pin bar, it’s like the market is telling you, “We tried to go this way, but we’re not staying.”

When you’re learning about pin bar signals, you’ll want to look at two key kinds.
The bearish pin bar has a long wick at the top. It starts with prices going up, but then it turns around and the prices fall, showing that sellers are in control. Then there’s the bullish pin bar, with its long wick at the bottom. Here, prices initially drop, but then they bounce back up, showing that buyers are stepping in and might just reverse the trend.
Types of Pin Bar Candlesticks
Not all pin bars look the same in that the pin (upper/lower shadow) may have different lengths. The more extreme the length of the shadow is, the stronger rejection has taken place.

The example on the left opened near the highs, there was a sell-off, and then the price regained to close at the high of the day.
Types of Pin Bars
- Bullish Pin Bar: This pin bar has a long lower tail, and a small body near the top of the candlestick, and indicates a rejection of lower prices. It suggests that the market may move upwards.
- Bearish Pin Bar: This pin bar has a long upper tail, and a small body near the bottom of the candlestick, and indicates a rejection of higher prices. It suggests that the market may move downwards.
Understanding these components and their significance can help traders identify potential market reversals and make informed trading decisions.
The right, price opened around the middle of the range, a sell-off, and then the price closed at the high of the day. The difference is the sell-off was not as strong as the one on the left. The strength of the pin bar you are trading may be a factor in determining how much risk to put on the trade. A strong pin may have you bump up the percentage risked while a weaker one may have you cut the position size.
Best Locations for Trading Pin Bars

Let’s look at two key areas where pin bars can shine: Price support/resistance zones and “moving average bounces”.
Whether using horizontal lines or angled trend lines, finding a pin bar on those locations can be a trading setup in itself. A moving average bounce can be a “cheat code” in finding other important price structures. Moving averages do not provide anything but information. If you see price “bouncing” from a moving average, look left and you will find structure to trade against 95% of the time.
Step-by-Step Guide for Trading Pin Bars
1. Indicators Required:
- Pin Bar: A candlestick pattern that indicates a reversal in the market trend.
- Moving Averages: Preferably a combination of a short-term (e.g., 20-period) and a long-term (e.g., 50-period) moving average to identify the trend and support/resistance levels.
- Support and Resistance Levels: Key levels where the price has historically faced resistance or support (look left when the pin bar is around a moving average).
2. Time Frame:
- This strategy can be applied to various time frames but is commonly used on the 1-hour, 4-hour, and daily charts.
3. Set Entry Points
- Bullish Pin Bar: Enter a long (buy) position when a bullish pin bar forms near a support level or moving average in an uptrend.
- Bearish Pin Bar: Enter a short (sell) position when a bearish pin bar forms near a resistance level or moving average in a downtrend.
- Trend Confirmation: The short-term moving average should be above the long-term moving average for a long position, and below for a short position.
4. Set Stop Loss + Take Profit
- Take Profit: Set take profit near the next significant resistance (for long positions) or support level (for short positions).
- Stop Loss: Place stop loss below the lowest point of the bullish pin bar (for long positions) or above the highest point of the bearish pin bar (for short positions).
- Trailing Stop Loss: Optionally, a trailing stop loss can be used to lock in profits as the price moves in your direction.
5. Risk Management:
- Risk a small percentage of the trading capital (e.g., 1-2%) on each trade to manage risk effectively.
6. Additional Considerations:
- Market Context: Always consider the overall market context. Avoid trading against strong trends.
- News Events: Be aware of major news events that might impact the market, as they can lead to increased volatility.
- Consolidation: If the price is whipping around the averages or the averages are snaking around each other, turn to range trading/breakout trading.
Trade Examples
This is a four-hour chart in an uptrend where you only look for buy trades. Clean setup and full position closed at price target.

This next example is an uptrend as well with a 50% position scale out at the next resistance above the entry. We then trail under each new candle low once the candle makes a new high. Do not trail under a candle that has not made a new high in an uptrend.

Your next step is to design a trading plan where the criteria are listed as a rule set. You need to define what makes a good pin bar to trade and which ones to skip.
Combine with Other Patterns
Combining pin bars with other candlestick patterns or trading strategies can enhance trading accuracy and effectiveness. One effective combination is the inside bar-pin bar combo pattern.
Inside Bar-Pin Bar Combo Pattern:
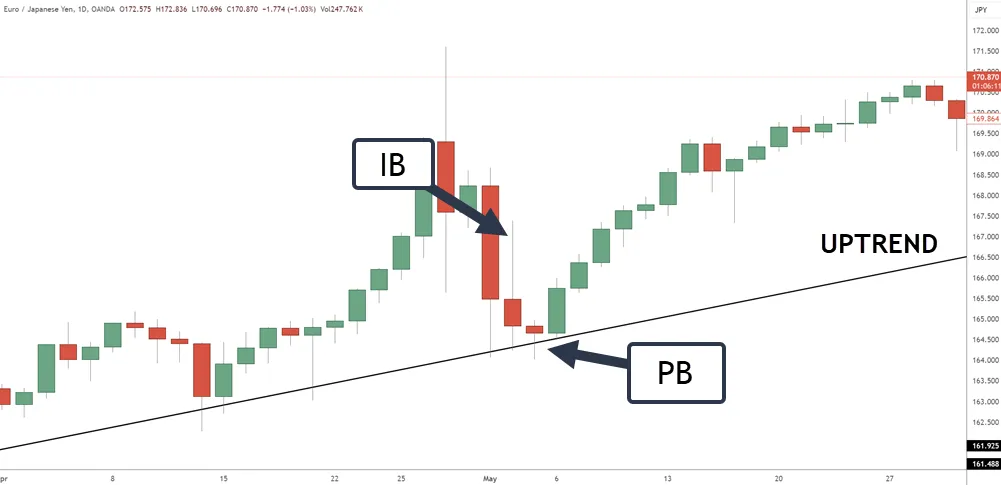
- Identify the Inside Bar: An inside bar (IB) is a candlestick that forms within the range of the previous candlestick, indicating consolidation.
- Look for the Pin Bar: After the inside bar, look for a pin bar (PB) that signals a potential breakout or reversal.
- Confirm the Signal: Ensure the pin bar forms at a key support or resistance level or in line with the overall trend.
- Set Entry Points:
- For a bullish inside bar-pin bar combo, enter a long position when the price breaks above the high of the pin bar.
- For a bearish inside bar-pin bar combo, enter a short position when the price breaks below the low of the pin bar.
- Set Stop Loss and Take Profit: Use the same approach as with individual pin bars, placing the stop loss 1 pip below the low (for bullish) or above the high (for bearish) of the pin bar and setting the take profit based on your risk-reward ratio.
By combining pin bars with other patterns like the inside bar, traders can increase the reliability of their signals and improve their overall trading performance.
Frequently Asked Questions
Can the Pin Bar Strategy Be Used in Other Financial Markets Aside From Forex?
The pin bar strategy can be used across various markets, including commodities. To enhance its effectiveness, you might want to pair it with additional simple trading techniques. To make the most of this trading strategy, consider using it with other easy-to-understand tools like support and resistance levels,
What Are Some Common Mistakes That Traders Make When Using the Pin Bar Strategy?
Some of the common mistakes are not paying enough attention to risk, jumping into trades too early without a clear signal, and not considering the main trend direction in which the market is moving. Managing risk means deciding how much money you’re okay with possibly losing on a trade and sticking to that limit.
Waiting for confirmation means being patient. A confirmation could be another candlestick closing in the direction you’re expecting the price to move.
Determine the trend direction and only trade in that direction until you gain more experience
Are There Any Specific Indicators That Can Be Used With the Pin Bar Strategy for Improved Accuracy?
Simple tools like average price lines (moving averages), the Fibonacci tool, and drawing lines on your chart to mark where prices tend to rise or fall (support and resistance levels) can be very useful. It’s also handy to draw lines that show the direction in which prices are moving over time (trendlines). All of these tools help you frame the instrument to gain an understanding of the next probably price move.
Can the Pin Bar Strategy Be Applied to Shorter Timeframes, Such as Intraday Trading?
You can use a shorter timeframe but it’s not without its challenges. When you zoom in on the shorter timeframes that day traders use, such as minutes or hours, things get a bit tricky as you get a more microscopic view of the price.
You’ll find more ‘noise’ – this means the price moves around a lot and it may look random. Because of this, you might see what looks like a pin bar forming, but it could just be the market’s general ups and downs, not a true signal to enter a trade.
Conclusion
Using the pin bar strategy in forex trading can be a smart way to spot when prices might change direction. A pin bar is a type of candlestick—a shape on a chart that shows the high, low, opening, and closing prices of a currency for a specific time. It looks like a pin or a nail, with a long stick (shadow) that points out that prices might move the other way.
To use this method well, it’s important to know where and how to look for these pin bars. You want to find them at places in the market that have been important before, where prices have changed direction in the past. When you see a pin bar with a long shadow, it suggests that the market could be about to turn in the opposite direction of the pin.
Putting this strategy into action and paying attention to the overall market situation, can lead to better trading results. Remember, trading is never a sure thing, but with careful study and a well-thought-out strategy, you can increase your chances of doing well.