Trading decisions based on concrete market evidence, rather than emotional impulses or assumptions (TRADE WHAT YOU SEE AND NOT WHAT YOU THINK) form the bases of successful trading. While many traders let their hopes, fears, and predictions drive their actions, professionals (and successful retail traders) understand that price action and volume (FX Futures) tell the real story.

The charts reveal objective truths about market behavior, yet countless people still struggle to separate what they want to see from what’s actually happening before them.
TLDR
- Focus on observable price action and established patterns rather than making predictions based on personal market opinions.
- Wait for clear pattern confirmations and high-volume/momentum breakouts before entering trades instead of anticipating potential movements.
- Use objective technical indicators and chart patterns for entry and exit decisions rather than emotional or speculative reasoning.
- Base trading decisions on actual market data and volume analysis instead of news headlines or market speculation.
- Follow established stop-loss and profit targets based on visible chart patterns rather than hoping for specific price movements.
Understanding key support levels helps identify optimal entry and exit points for more precise trading decisions.
Professional traders rely on price action trading to spot high-probability setups without using complex indicators.
Pattern-Based Technical Analysis
Trading What You See is a technical analysis strategy focused on identifying and trading established chart patterns, combining visual pattern recognition with volume analysis to capitalize on predictable market behavior.

This approach looks to capture high-probability trade setups by waiting for clear pattern confirmations rather than attempting to predict market movements, ultimately providing traders with objective entry and exit points.
Market sentiment analysis provides important insight into trader psychology during consolidation phases, helping validate pattern formations.
Utilizing stochastic oscillator settings of 14,3,3 helps identify overbought and oversold conditions during pattern development.
| Indicator/Pattern | Purpose | Settings/Conditions |
|---|---|---|
| Trendlines | Identify pattern boundaries and breakout levels | Connect at least 2-3 major highs/lows |
| Volume | Confirm pattern validity and breakout strength | Compare to 20-period average volume |
| Head & Shoulders | Identify potential trend reversals | Must have clear neckline and symmetrical shoulders |
| Double Tops/Bottoms | Spot reversal opportunities | Price must test level twice with clear rejection |
| Flags/Pennants | Locate continuation opportunities | Must form after strong trend move with decreasing volume |
| Triangles | Find consolidation breakout points | Minimum of 2 higher lows and 2 lower highs |
Trading Strategy Details
Pattern-based trading requires patience and discipline to wait for clear pattern formations rather than forcing trades. This strategy emphasizes the relationship between price action and volume/momentum to validate patterns and confirm breakouts, reducing failed signals.

- Identify the prevailing trend using higher timeframe analysis
- Draw trendlines to outline potential pattern formations
- Monitor volume characteristics during pattern development (monitor FX futures)
- Wait for pattern completion and breakout confirmation
- Enter trade when price breaks pattern boundary with increased volume
- Set initial targets at 1.5x pattern height for symmetrical patterns
- Trail stops below key swing points for trending moves
Risk Management
Position size should not exceed 1-2% of total account value per trade. Set initial stops below pattern support for long trades or above pattern resistance for short trades. Scale position size based on pattern reliability and market conditions:
- Reduce position size by 50% during high volatility periods
- Increase size to maximum 2% for highest probability setups
- Use tight stops on counter-trend trades
- Split entries on breakouts to reduce false signal risk – especially vital on trading failed breakout reversals.
- Exit half position at first target and trail remainder with wider stops
During ranging markets, focus on reversal patterns and require stronger volume confirmation. In trending markets, prioritize continuation patterns and allow for wider stops to capture larger moves.
Follow High-Volume Breakouts
Successful traders recognize that volume analysis serves as a decent helper for validating price movements and confirming genuine market breakouts. If you trade what you think should happen instead of what is actually happening, you could rack up the losing trades.
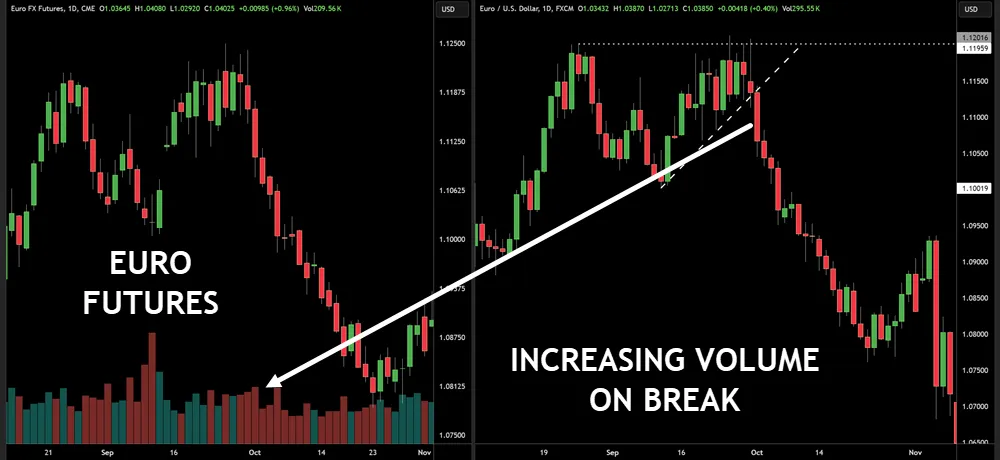
The combination of increased trading volume with price action provides traders with a reliable framework for distinguishing between true breakouts and false signals, particularly when volume spikes coincide with key technical levels.
When substantial volume accompanies a breakout, it signals strong market conviction and suggests that institutional investors, who typically drive significant volume changes, are actively participating in the move.
Candlestick reversal patterns can provide additional confirmation when analyzing high-volume breakouts, especially at critical support and resistance zones.
Volume Analysis Drives Decisions
Volume can be an important indicator when analyzing breakout opportunities in any trading strategy. Traders who add volume trends into their decision making process often find themselves better positioned to identify genuine breakouts from false signals, particularly during volatile market conditions.
- High-volume breakouts typically signal stronger market conviction, making them more reliable for trade execution and position sizing.
- Volume analysis helps traders validate price movements by confirming whether sufficient market participation exists to sustain the breakout.
- Combining volume indicators with technical analysis tools provides a more comprehensive framework for understanding market dynamics.
When volume surges coincide with price breakouts, traders can more confidently execute their strategies, knowing that significant market participation supports the movement. This validation through volume analysis becomes particularly important during critical market transitions.
Market Timing Risks Profits
Although market timing may seem like an attractive way to maximize profits, research shows that investors must achieve an extraordinarily high accuracy rate of 74% just to outperform a benchmark portfolio of similar risk.
Studies consistently demonstrate that timing inaccuracies and market psychology often lead traders to make poor decisions, particularly during volatile periods. Missing just a few of the market’s best-performing days can dramatically reduce long-term returns, transforming what could have been substantial gains into losses.
For example, investors who missed the top 20 trading days over a 20-year period in the S&P 500 saw their 9.22% annual return evaporate.
Even professional managers and target-date funds struggle with market timing, frequently underperforming their buy-and-hold counterparts by as much as 3.8% over three decades.
Exit When Signals End
Rather than chasing market timing opportunities, traders can focus on clear exit signals that help protect their capital and secure profits.

Technical indicators combined with time-based strategies provide reliable frameworks for executing market exits when conditions change.
- Moving average crossovers and RSI levels offer objective exit signals, helping traders avoid emotional decision-making during market reversals.
- Trailing stop-losses and break-even strategies protect accumulated profits while maintaining position flexibility.
- Session-based exits and consolidation patterns provide natural closing points that align with market structure.
When multiple exit signals converge, traders should respect these warnings rather than hoping for additional gains.
The most successful traders understand that preserving capital through disciplined exits is just as important as finding profitable entries.
Your Questions Answered
How Long Should I Practice Paper Trading Before Using Real Money?
The recommended paper trading duration varies based on trading style and experience level, typically ranging from 4 months for day traders to 12 months for position traders.
Traders should continue until they achieve consistent returns that meet their monthly goals over several months.
Market confidence develops naturally through this process, but it’s important to demonstrate profitability in simulated trading before risking real capital.
Which Charting Software Is Best for Identifying High-Volume Trading Patterns?
Based on comprehensive volume analysis features and pattern recognition capabilities, Metatrader and TradingView stand out as premier charting software choices. Keep in mind the Forex market does not have valid volume data. Use FX futures if possible for volume reads.
Bookmap’s heatmap visualization excels at showing real-time market depth and liquidity concentrations, while TradingView offers strong technical analysis tools and cross-asset comparisons.
For traders specifically focused on high-volume patterns, these platforms provide essential tools through their sophisticated order flow tracking and advanced statistical indicators.
Can This Trading Strategy Work in Cryptocurrency Markets?
The “Trade What You See” approach can be effectively applied to cryptocurrency markets, though traders must account for heightened cryptocurrency volatility and maintain strict trading psychology.
Technical analysis tools, including volume indicators and price action patterns, work similarly in crypto as in traditional markets.
Successful implementation requires disciplined adherence to predefined rules and resistance to emotional decision-making, especially during extreme market swings.
What Percentage of My Portfolio Should I Risk per Trade?
Professional risk management guidelines typically suggest limiting exposure to 1-2% of total portfolio value per trade.
This conservative approach helps protect capital while allowing for consistent growth opportunities. For more aggressive traders, up to 5% may be acceptable, though this significantly increases potential losses.
Portfolio allocation should always prioritize preservation of capital through proper position sizing and diversification.
Should I Consider Fundamentals at All When Trading Based on Patterns?
While patterns provide trading signals through technical indicators, incorporating fundamental analysis can strengthen decision-making by validating the underlying health of assets.
Traders should consider basic fundamentals like earnings reports, industry trends, and major news events that could impact price movement. However, for short-term trading, technical analysis should remain the primary focus, with fundamentals serving as a supplementary filter rather than a primary decision maker.