In my weekly Forex setups, I have mentioned before I don’t post all of the instruments I am watching for the week (and beyond).
The purpose has always been to teach you – not feed you. There is more power in you learning:
- What a setup looks like
- When a setup fails and finding if there is still opportunity
- Not every setup will trigger
- Various ways to enter a trade including lower time frame usage
Over the years, I have received so many great comments (some not so great from those looking to be fed) which let’s me know my approach with the blog, is the right one.
This past week I saw a setup on the USDCAD pair that wasn’t listed in my setups. I want to cover this particular trade from the other ones I had because the lesson is: simple works.

- Trend lines have no magic but they can segment the chart for you. The key to drawing a trend line is to ensure the last swing point that leads to a new high or low, is connected.
- The pair was in a trading range
- Price drove from resistance all the way into support and broke out. Any breakout that starts from one extreme, is usually a low probability play. Expect a pullback especially when the move down is a complex swing (A-B=C-D)
- Price pulls back after the breakout in a complex correction and bases. Our lower time frame shows a range
I want to show you the broker chart so you can see this is a real trade and highlight other important points.
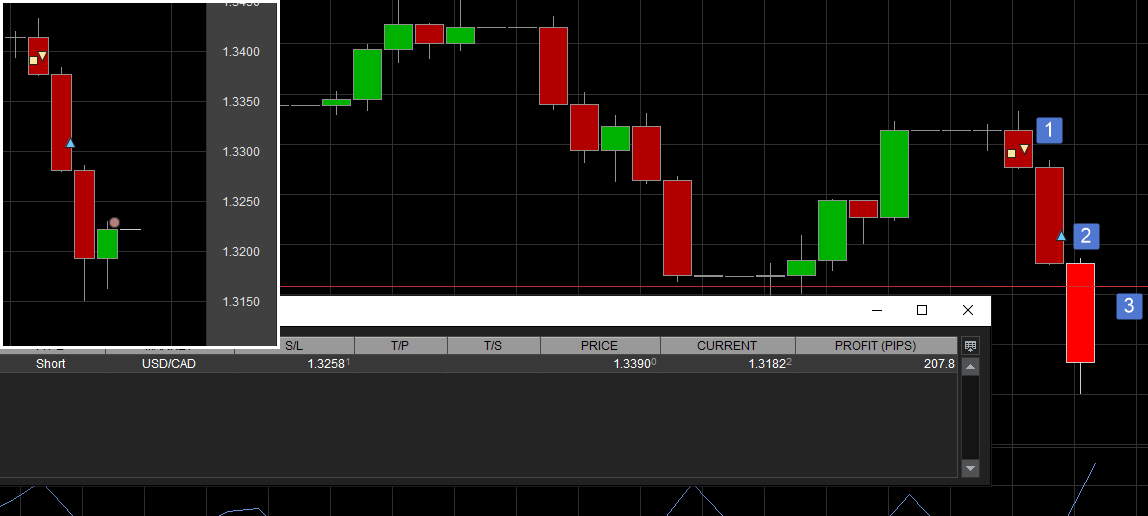
- The entry was at 1.3390 and if you look at your four hour chart, you will see a range at that price. The entry was a breakout of a range on a lower time frame to get into a pullback trade on the higher time frame. That is the proper use of multiple time frame trading.
- This is a scale out of the trade while leaving a runner. This is a risk management move and ensures that I will not take a loss on the trade
- This was the trailing stop however as you will see in the inset window, the stop out for profit was lower. I was using a 1.5 X ATR from lows and adjusted the stop after the red candle closed
In short,
- Price broke from a range and I expected a pullback
- Price pulled back halfway into the range
- A range formed on the lower time frame setting up a breakout entry into the pullback
- Stop was set at 1.5 ATR (I keep a tighter stop on pairs that don’t tend to trend very well)
- Scale out and trail
Simple Works In Trading
We do not need a thousand different trading indicators or rules. The pullback is a price move that has been happening in the markets since there have been markets.
Breakouts are naturally occurring and must happen or price will never trend.
Combining the two is a common sense approach and is one that has increased my trading account over the years in more ways than I can count.
Any questions….please comment.