Hello Traders, in this post, I’m going to show you some advanced multiple timeframe trading techniques which you can use on any trade setup that forms in the larger timeframe. A few chart examples given below will really make this easy for you to digest.
I use these advanced multiple timeframe trading techniques a lot but I’ve never really had the opportunity to fully explain in detail how I use them because writing it out was going to take a lot of time, and in fact it did, almost 4 hours on this post but I think its worth it and you’ll learn some things you may have never been made aware of previously.
Disclaimer: It doesn’t mean that you have to use these advanced multiple timeframe techniques but you may find the ideas useful or you may stick to what you know best. Sometimes the less confusion you have, the better you will become as a trader.
By the way, don’t forget to share, like, tweet, link & mention to your fans and friends at the end of this post if you like it.
So What is “patterns within a pattern?”
Patterns within a pattern is simply finding patterns to trade within a pattern and that can only be done using multiple timeframe trading.
For example, if there is a trendline trading setup on the daily timeframe, you can find a lot of other trading pattern setups within that trendline trading setup when you switch to smaller timeframes like the 4hr or 1 hr or even smaller timeframes below them.
I will explain this with charts below so you will really see what I’m talking about here.
As I mentioned on this post about how to do multiple timeframe trading in 3 simple steps, when I run through my charts to look for price action trading setups, I use what I call a “top down technical analysis”.
A top down technical analysis means I start with the larger timeframe first and look for trading setups there and then work my way down to the smaller timeframes.
And if you are using the mt4 trading platform, the largest timeframe will be the monthly timeframe.
Each timeframe that I look at, I am asking myself these questions:
- is there a major support and resistance level? Is price near it or not?
- can I draw a trendline connecting the swing highs/swing lows and is price close to that trendline or not?
- are there chart patterns like head and shoulders etc that I can spot or not?
- are there any diagonal price channel formation happening or not?
- is price heading to a fibonacci retracement level like the 61.8% or not?
- is there a confluence of levels? Like trendline meeting 61.8 Fib level?
By doing that, I generate trade setups that I know may form in the very near future and that is the exact process used to generated the free forex trading signals that I publish every week.
There’s More Than One Way To Skin A Cat
There’s this saying ” there’s more than one way to skin a cat”.
Similarly, what I’m going to show you here is more than one way to take a trade based on a trade setup that happens in the larger timeframe when you start using multiple timeframe trading and switching down to a lower timeframe.
So there are two things at play here:
- a trade setup based on a larger timeframe like the daily
- and trade setups based on a smaller timeframe like the 4hr or the 1hr that supports or confirms what is being seen in the larger timeframe trade setup.
Now, you may be wondering: what are the advantages or benefits of this?
Well, what about these 5?:
#1: Not missing a really good trade setup?
Sometimes, you’ll miss out to buy or sell exactly at that ideal location where you want based on your trade setup.
And guess what?
Price may have moved ahead already and jumping in would be like chasing after a bus that has left you. Pointless and waste of time and energy (and money) if you do jump in late.
But, with what I’m going to show you here, even if the price has moved from the ideal buy/sell spot that you were waiting for, sometimes, it creates reliable patterns (setups) just after that and if you know them, you can jump in.
Many traders miss these setups because they are looking for only one setup or pattern and they if they see that it has already formed and price has moved, they think its over.
But in reality, they have not trained their eyes or mind to spot the other reliable trading setups that form “within” that setup in the larger timeframe so what happens is that they let a very profitable trade setup get away while they do nothing.
#2: Adding another layer of trade entry confirmation?
This simply means that you got the first layer of analysis, which is the trade setup based on the larger timeframe and then switching to a smaller timeframe to look for other patterns within that only confirms what you see in the larger timeframe before taking that trade.
This means that you are adding another layer of confirmation, which, generally speaking, makes your trade entries better than just depending on only one layer of confirmation.
#3: Better trade entries? I want to be wrong fast or be right fast.
That’s one of the biggest benefit or multiple timeframe trading.
The reason why I trade using multiple timeframe trading so much is because I don’t like waiting for ever for price to move in the desired direction.
If you trade using the daily timeframe, price can move back and forth so many times…you’ll see profit, then you’ll see loss, then you’ll see profit, then you’ll see loss.
It’s like seesaw, playing with your mind.
I’m not a fan of that.
If I’m wrong, I want to be wrong fast and get stopped out quickly with a tight stop loss.
I’f I’m right, I want to be in profit quickly without all the seesawing.
Some of you may disagree with me on this but as I said, there’s more than one way to skin a cat. I like to skin mine this way.
#4: Tight stop loss with less chance of getting stopped out?
This gives you the chance to trade large size contracts without increasing your trading risk because of your tight stop loss.
Believe me, this is one simple and very effective way to increase the size of your trading account quickly.
#5: Better risk:reward?
Again, this is also one of the greatest benefit of multiple timeframe trading because if your stop loss is tight and price quickly moves as anticipated, your risk to reward is much better than the trader who trades in the daily timeframe with a much larger stop loss.
Price has to travel a long way before he gets a reasonable risk:reward ratio like 1:3 or more.
But if you trade in a smaller timeframe and price moves quickly as anticipated, you are in profit much quicker than that trader that traded in the larger timeframe.
In this post, how trading risk:reward ratio can increase your trading account fast, I gave some good examples of this situation. Please check it out.
An Example Of Patterns Within Pattern
Here’s an example that would really make this concept easy to understand.
The chart below shows a USDJPY trade setup alert I identified using the process given above and alerted traders about it a couple of days in advance before it actually happened:

And here’s what happened afterwords: price moves 470 pips as anticipated.

If you were watching to trade this setup in the daily timeframe, you’d only see two sell signals:

Ok, here are the important points:
- this setup was a trendline trading setup (sell setup) based on the daily timeframe.
- the patterns to look for in this daily timeframe will be bearish reversal candlestick patterns…because there’s nothing else you can find in that timeframe except what’s already being formed and given in that timeframe.
But what If you were to take this a bit further? What if you went down to the 4hr timeframe and was waiting there for some sell signals? What patterns/setups could you have seen?
Lets Look At The 4Hr Timeframe.
How many patterns or sell setups that you can find that could have allowed you to take a sell trade?
#1: Was there Any fibonacci level retracement sell setup Pattern?
Yes.
Price went up to 61.8 and then moved down. At the point where the 61.8 fib level was it, price also hit again the major falling trendline. That is the “sell signal 1” point shown in the daily chart above.
You can also see a good bearish reversal candlestick pattern which could have been used as a trigger to place your sell stop pending order just a few pips below its low and the breakout of that would made you some quick profits quite quickly.
Application: sometimes, you will miss the first time price hits the trendline and bounces (the ideal buy/sell level), then you look for such situation as these:
- a move back to touch the trendline for the 2nd, 3rd time etc
- or a move up to the 61.8 or 50 % fib retracement zone
All these trade setup patterns must be confirmed with bullish/bearish reversal candlesticks patterns as your signal to buy/sell.

#2: Was There Any Sell Trendline Trading Setup Pattern?
Yes.
As you can see below, you have the main trendline, which is the main setup but within that, there was also this 4hr trendline which could have been used to sell as well.
Application: sometimes, price will give you great opportunities like below where you can draw “small trendlines” within the “main trendline” and if you have missed the first ideal trade entry point, this is how you can get into a trade with a tight stop loss (with less chance of getting stopped out) and also good risk:reward if trade goes as anticipated.
You should confirm with bullish/bearish reversal candlesticks patterns as your signal to buy/sell when you encounter situation like shown below.

#3: Was There Any Trendline Breakout Setup Pattern?
Yes.
Very simple stuff, really. You could have also drawn this upward trendline in the 4hr timeframe and once a candlestick closes below it, you could then place a pending sell stop order to catch the dowward breakout.
Application: again, lets assume that you miss the first trade setup when the trendline touched the main trendline but you draw this upward trendline and wait for a breakout to the downside. You see a 4hr candlestick close below that trendline, that is your sell signal. You place a sell stop pending order a few pips below the low and the next candlestick forms and gets your order activated and you are in profit.

#4: Was There Any Trendline Restest Setup Pattern?
Yes.
If a trendline breaks, always watch to see if price has a chance of coming back to test it and when it does, you look for bearish reversal candlesticks to sell.
In this case, it did!
Application: again, a condition like this can be useful if you miss the first trade entry when price touched the main trendline for the first time and you also miss the trendline breakout setup as shown in #3 above. This is how you can get into a trade. The bounce down when price hits the trendline it just broke confirms what happened on the daily timeframe increasing your odds of success on this trade.

#5: Was There Any 1-2-3 Pattern Setup?
Yes.
Again, very simple stuff.
This is really useful if you have missed entering the sell trade entry on the first touch of trendline on position 1.
So what you do is wait to see if there are any 123 patterns and trade the breakout of 2.
Application: again, lets say that you’ve been waiting patiently for this setup so you can trade but you just missed it somehow. How can I enter this setup that has already moved away from the ideal entry point, you think. Well, sometimes, things are so easy as 123. Look for a 123 pattern and trade the breakout of the support level in point 2. In the case of a upward trendline, trade the breakout of the resistance level in point 2.
Really simple stuff, when you think about it.

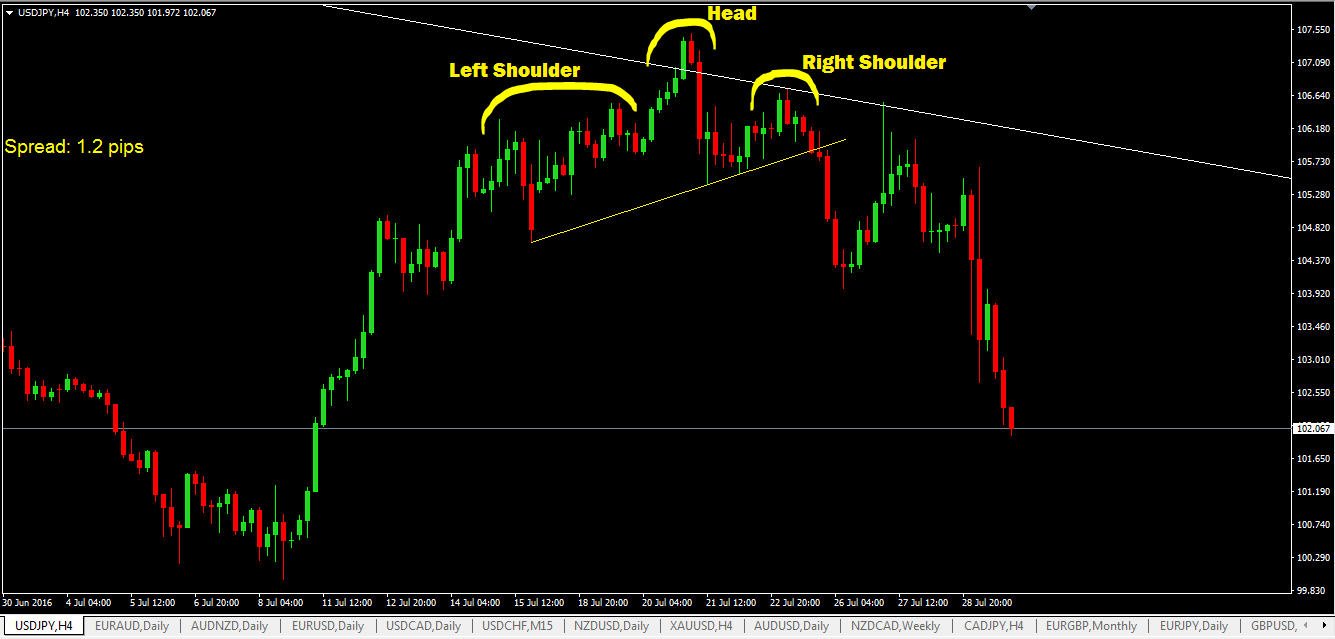
#6: Was There Any Head And Shoulder Pattern?
Yes.
As you can see below, there was a head and shoulders pattern, which is bearish reversal pattern by the way.
Application: again, you may miss to first trade setup and price has moved a bit.
You just don’t quit yet.
You see, the trendline setup on the daily hides this head and shoulder pattern that was forming in the 4hr timeframe. And this goes to other setups that form in the larger timeframes.
So when you are in such situation as this, always ask yourself ” What patterns can I find when I switch to a lower timeframe?”
Once you ask that question, it becomes much easier for you to focus and see these patterns that are forming when others are missing them.
#7: Was There Any Triangle Chart Pattern?
Yes. A Symmetrical Triangle Chart Pattern.
Don’t forget the triangle patterns when you are switching down to the smaller timeframes, they tend to create some really good trading opportunities.
Application: again, you miss the first trade setup but then once you switch to a lower timeframe, you can see this symmetrical triangle chart pattern and you can see that price is being constricted towards a point and sooner or later it is going to breakout of that triangle pattern and it did. The trading of this setup would be the same as trading the Trendline Breakout given in #3.

So as you can see, there was one pattern but in that one pattern, there were 7 other patterns. That’s what you do in multiple timeframe trading.
Here’s Another Slightly Different Example
This one here is a slightly different example but the core concept still remains the same: looking for patterns within a pattern.
In this case, the trade setup forms in the daily timeframe and you have not missed the trade but you are trying to look for an EARLY trade entry in a much lower timeframe.
Again, I will go back to one of the forex trading signals/trade alerts I sent out on XAUUSD where I identified a support level on 1300 and as price was going down to it, I sent out an alert to trades telling them to watch that support level for any bullish reversal candlestick patterns and here’s what happened:

Now,
- lets assume that you switched to a lower timeframe, the 1hr and were waiting there to look for a buy signal so you can get an early buy trade.
- so you think that if price breaks the high of the INDSIDE BAR on the daily timeframe, there’s a great chance of an explosive move upward.
- so you want to get in early before that happens. so you’d be already in profit by that time with a tight stop loss which really makes your risk:reward ratio look really excellent.
Switching to the 1hr timeframe, these are some of the patterns you could have easily identified as shown on the 1 hr chart below.

See what I’m talking about now? So that’s what you do in multiple timeframe trading.
I know, if you are new to this, it might be a really difficult concept to grasp but read twice or 3 times to really understand it and next thing you do is open these charts I’ve shown here and go over them and see what I’m talking about.
And then do your own homework and open up other charts and look for patterns and find the patterns within them.
That’s the only way you will learn.
Any bullish or bearish reversal candlestick that forms in the larger timeframes has patterns within it. You just need to know what to look for and how to identify them and take trades based on those.
What About Other Trading Setups?
The examples I’ve given above are based on on the trendline trading setup as well as the bullish harami candlestick that formed on a major support level on the daily and the patterns you can find are not restricted to just these kinds of setup.
You can find many different patterns on:
- major support and resistance levels in the larger timeframes when you switch to a lower timeframe.
- You can also find patterns with reversal candlesticks patterns that form in the larger timeframes when you switch to a lower timeframe. For example, in a bearish/bullish harami candlestick pattern that forms in the daily timeframe, if you switch down to a lower timeframe like the 1hr, you will most likely see a symmetrical triangle pattern there. And if you see a symmetrical triangle there, then that means you have two trendlines, which means you either can have a trendline trading setup, a trendline breakout setup or trendline re-test setup happening.
So really, you are not restricted to just one pattern when you think outside the box a little bit.
Look for ALL possible patterns in a pattern.
Summary
So there, you have it.
As you can see from the examples above that the larger timeframe setups hide many valid trading setups that form in the lower timeframes. In the example given above with USDJPY:
- there was one main trade setup (the trendline trading setup in the daily timeframe)
- but when I switched down to the 4hr timeframe, I found 7 trade other trade setups that could have been used as well to open a sell trade.
There will be times when you may miss a trade setup and you will see price has moved already from where you really want to buy/sell and you think its over but using these techniques, I’ve given you here, you can wait and watch for these other trading setups to form in the lower timeframes and then buy/sell.
What I’ve shown you is how you can take a trade setup in the larger timeframe, switch down to a much smaller timeframe and look for other patterns in there that confirm that setup that is the larger timeframe and take the trade based on that.
Need more clarity or still getting confused about this? Make a comment and ask. And don’t forget to share, tweet, like, mention to your friends/fans etc.