When you’re trading with support and resistance levels, you’ll see that price doesn’t move randomly but tends to respect certain historical boundaries. These invisible and sometimes powerful price zones act like magnets, attracting and rejecting market movements with surprising consistency.
You’ve probably noticed how prices often bounce off these levels multiple times, creating opportunities for both buyers and sellers. While this strategy might seem straightforward, there’s more to mastering support and resistance than just drawing horizontal lines – it’s about understanding the psychology behind these turning points.
Thousands of traders have downloaded my free trading guide: 50 EMA Forex Trading Strategy
TLDR
- Support and resistance levels are price areas where buying and selling pressure historically converge, creating potential reversal points.
- Validate levels by looking for at least 2-3 price touches and combining with candlestick patterns like pin bars and engulfing patterns.
- Use multiple timeframes, starting with daily charts to identify major levels, then 4-hour and 1-hour charts for entry signals.
- Place stop-losses 10-15 pips below support for long positions and above resistance for short positions.
- Consider support/resistance as zones rather than exact price points, and confirm breakouts with increased trading volume.
Trading Strategy
Support and Resistance Trading Strategy targets price reversals at established market levels where buying and selling pressure historically converge. This strategy capitalizes on the tendency of prices to bounce off support levels and reject resistance zones, enabling traders to capture profitable moves while maintaining defined risk parameters.
When properly executed, traders can achieve consistent returns by entering positions at high-probability reversal points while protecting capital through smart stop placement. Market sentiment analysis reveals important clues into trader actions during consolidation phases.
Candlestick pattern recognition helps validate potential reversal signals at key support and resistance levels.
| Indicator/Pattern | Purpose | Settings/Conditions |
|---|---|---|
| Support/Resistance Lines | Identify key price levels for reversals | Multiple price touches (minimum 2-3) |
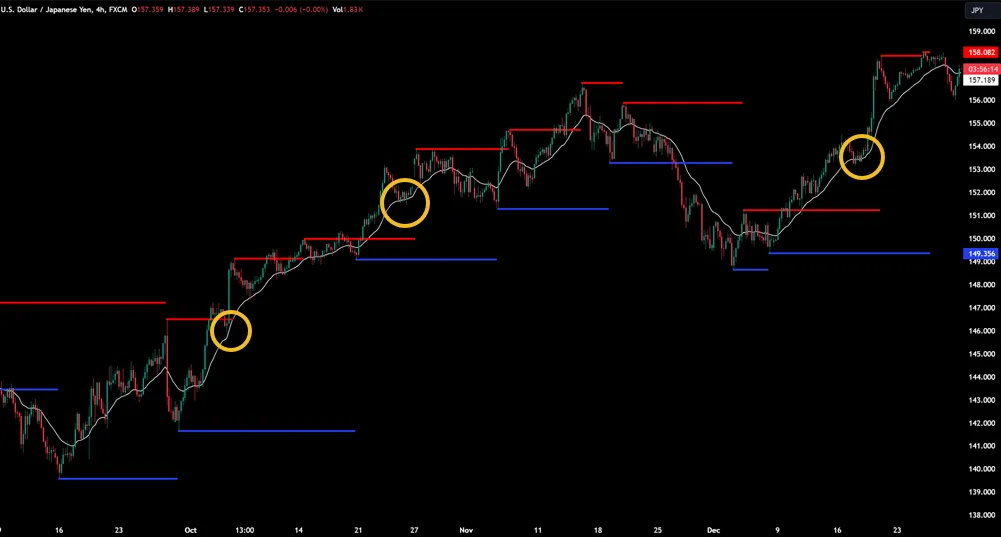
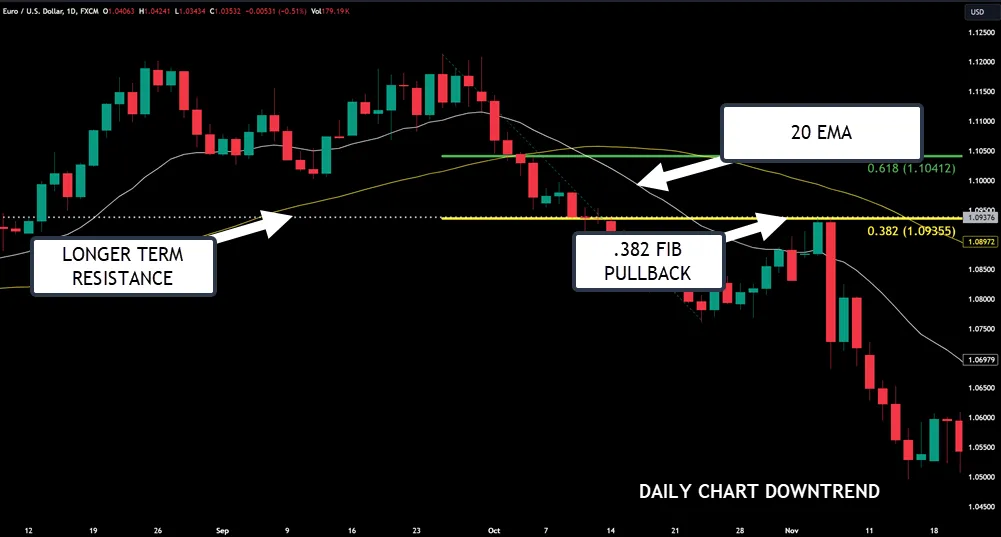
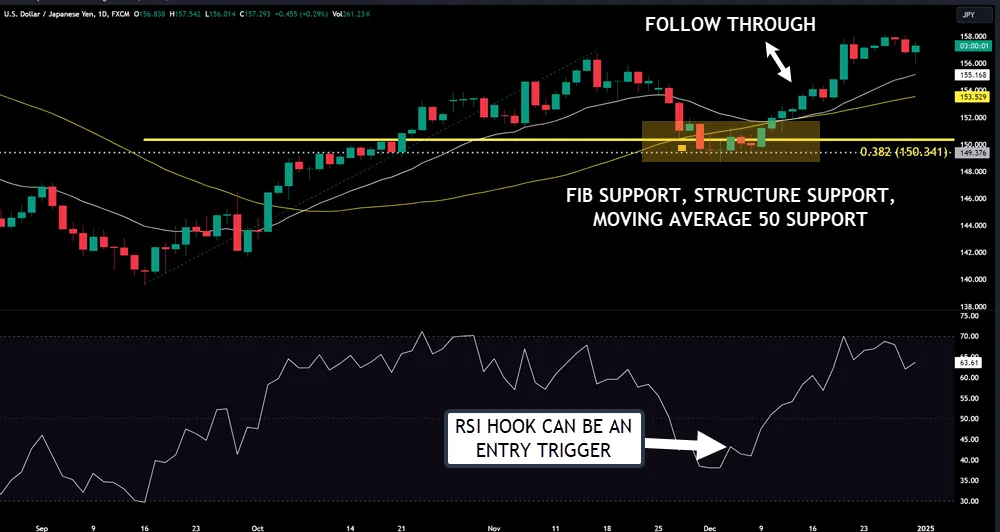
| Moving Averages | Dynamic support/resistance levels | 20 EMA, 50 SMA for trend direction |
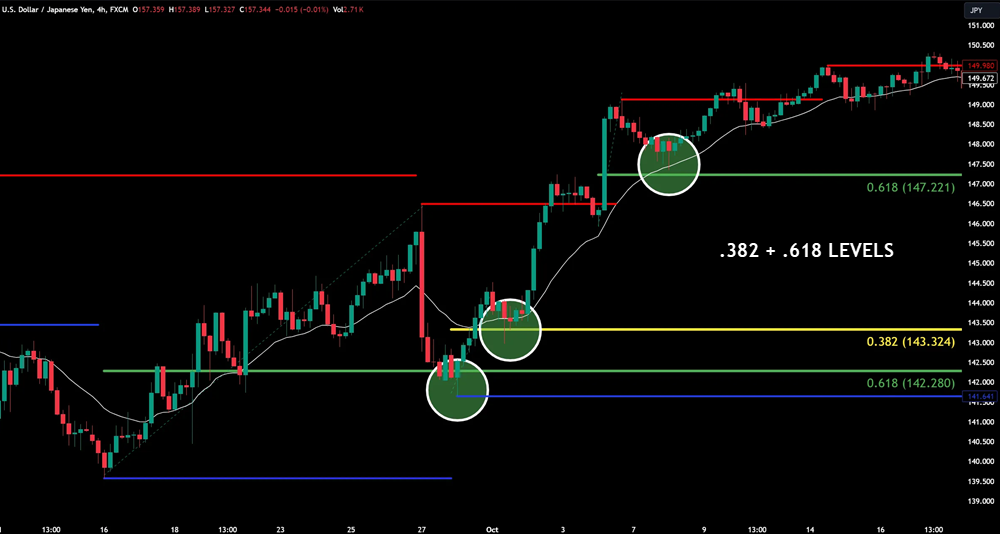
| Fibonacci Retracement | Additional confirmation levels | 38.2%, 50%, 61.8% levels |
| Pin Bars | Entry signal confirmation | Forms at support/resistance |
| Engulfing Patterns | Entry signal confirmation | Forms at support/resistance |
Trading Strategy Details
The strategy combines static support/resistance levels with dynamic indicators and candlestick patterns to generate high-probability trade setups. This multi-layered approach reduces false signals/failed trades by requiring confirmation from multiple technical elements before trade execution.
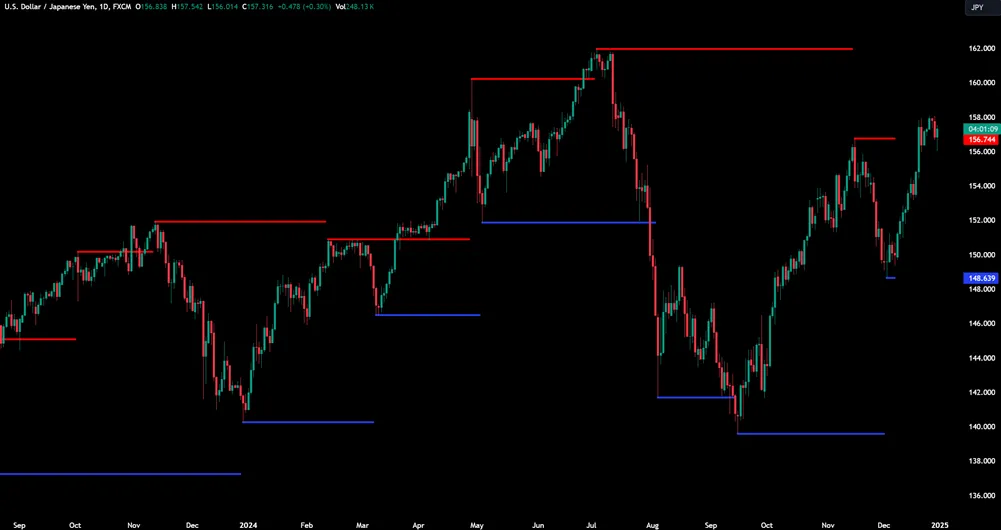
- Identify major support and resistance levels on daily timeframe
- Mark Fibonacci retracement levels during trending markets
- Monitor 4-hour and 1-hour charts for entry signals
- Enter long positions when (choose):
- Price touches support level zone
- Bullish candlestick pattern forms
- Moving averages broken by candle
- Minor resistance zone broken
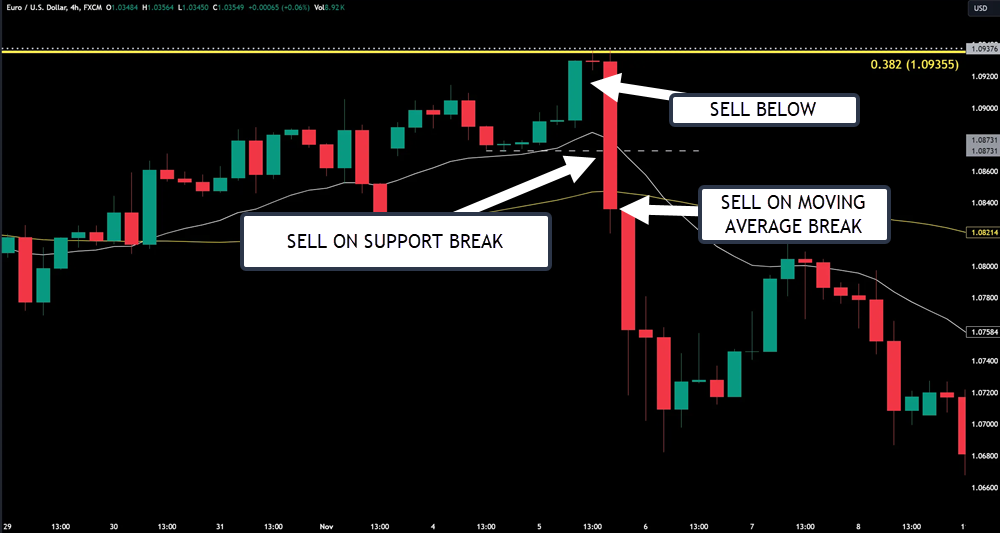
- Enter short positions when (choose):
- Price touches resistance level zone
- Bearish candlestick pattern forms
- Moving averages broken by candle
- Minor support zone broken
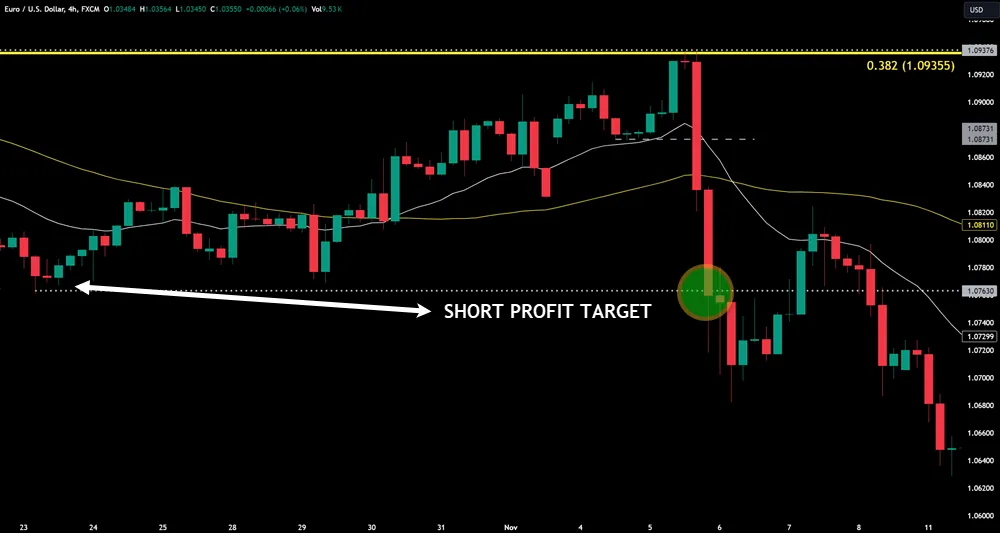
Set profit targets at next major resistance (for longs) or support (for shorts)
Risk Management
Set stop-loss orders 10-15 pips below support for long positions or above resistance for short positions. Limit position size to 1-2% of trading capital per trade. Scale position sizes based on setup quality – stronger setups could have larger positions within risk parameters that you have set.
During high volatility, widen stops by 5-10 pips and reduce position size in line with the increased stop distance. In trending markets, trail stops using moving averages to protect profits or consider using swing lows/highs to trail your stop.
Key: Exit trades immediately if price breaks support/resistance with strong momentum, regardless of stop placement.
Strategy Tips
To increase your success with the support and resistance trading strategy, several proven tips can improve your execution and results.
When you identify support and resistance levels, you’ll want to focus on areas where price has touched multiple times, as these zones tend to be more reliable for your trading decisions. The number of touches you will see depends on the time frame you are using. A daily chart will generally have less touches on a zone than a five minute chart.
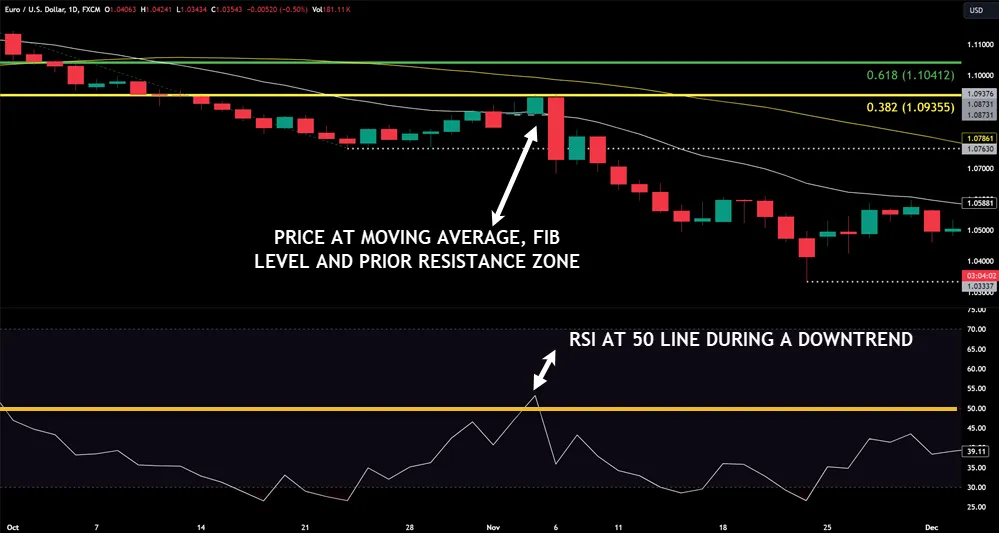
You’ll find that buying and selling near established levels works best when you confirm your entries with technical indicators. I’ve found that combining RSI readings with Fibonacci retracement levels can help you pinpoint more precise entry and exit points, especially when price approaches key support or resistance zones.
Managing risk is important, so you’ll need to place your stop-loss orders in areas that allows the trade to run but protects against aggressive downside price movement. I recommend setting them just below support when going long and above resistance when shorting, giving your trades enough room to breathe while protecting your capital from sudden price movements.
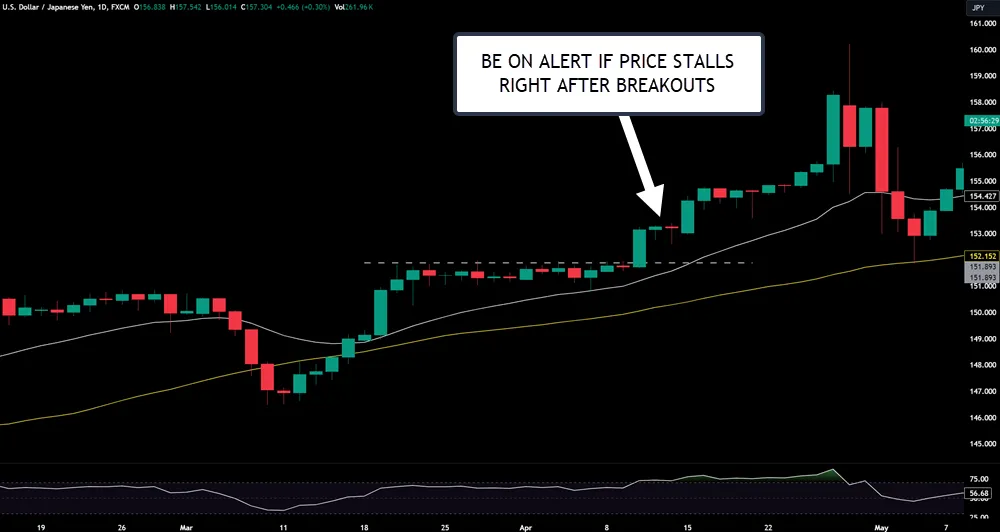
When you’re considering a breakout strategy, don’t forget to monitor trading momentum carefully. You’ll want to see increased momentum accompanying any breakthrough of support or resistance levels, as this validates the move’s strength and sustainability. I’ve seen countless traders jump into false breakouts because they ignored momentum confirmation.
In other instruments, I use volume but Forex does not have a centralized exchange to record true volume. You can use FX futures as a proxy for volume and is something I do.
Remember that successful trading strategies often combine multiple approaches. You might find that using support and resistance levels alongside momentum indicators and volume analysis gives you a more complete trading picture, helping you make better-informed decisions while keeping risk in check.
Professional traders often rely on price action trading without the need for additional technical indicators
Pros And Cons
Trading with support and resistance levels offers traders a structured approach to identifying potential entry and exit points in the market. These psychological price barriers, formed by historical trading activity, create areas where prices tend to bounce or reverse, providing opportunities for traders to capitalize on predictable price movements.
The widespread recognition of these levels among market participants often leads to self-fulfilling prophecies, as collective trading actions reinforce these price points. Similar to the CCI trading strategy, multiple timeframe analysis can enhance the reliability of support and resistance levels.
However, traders must be aware of the inherent risks associated with this strategy. False breakouts can trap traders in unfavorable positions, while an overreliance on technical levels may cause traders to overlook important fundamental factors affecting market dynamics such as a news release.
Additionally, emotional responses at these price points can lead to poor decision-making, highlighting the importance of maintaining discipline and following predetermined trading plans.
Positives:
- High-probability entry and exit points with favorable risk-reward ratios
- Clear price levels for setting stop-loss and take-profit orders
- Improved trading confidence due to widely recognized price levels
Negatives:
- Risk of false breakouts leading to trading losses
- Potential oversight of important fundamental factors
- Emotional decision-making challenges at critical price points
Research shows that breakout failure rates can reach up to 70%, making proper confirmation techniques and risk management essential for successful trading.
Final Tips
These final tips will help you maximize your success with support and resistance trading strategies. As a price action trader myself, I’ve learned that combining multiple technical analysis approaches with solid risk management strategies creates the most reliable trading system.
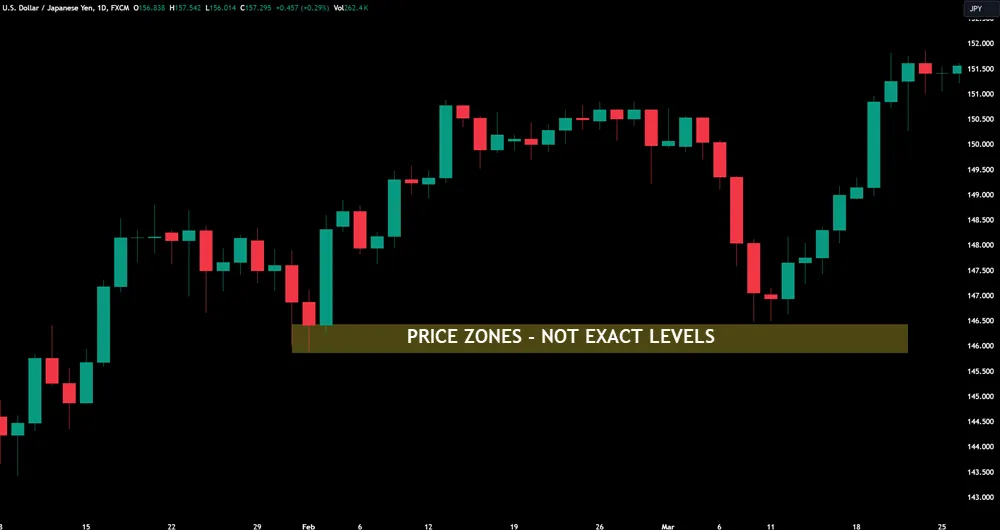
- When you identify support and resistance zones, don’t get fixated on exact price levels – instead, visualize them as areas where market trends might reverse or pause. You’ll find this flexibility helps you avoid getting stopped out by minor price breaks. Watching for trapped traders setups near these zones can provide additional confirmation of potential reversals.
- Before entering any trade, make sure you’re seeing confluence between different technical indicators. I like to combine moving averages, trendlines, and previous price movement patterns to confirm my key levels, which significantly improves accuracy.
- Always watch price action around your identified zones, looking for specific candlestick patterns that confirm your analysis. I’ve found that combining these patterns with support and resistance levels produces much more reliable trading signals.
- Your risk management strategies should include placing stop-loss orders at logical levels – typically just below support when buying or above resistance when selling. You’ll want to adjust your position size based on these stop levels to maintain consistent risk across trades.
For optimal results, consider using the Awesome Oscillator to validate momentum shifts when price approaches key support and resistance levels.
Your Questions Answered
What Is the Best Strategy With Support and Resistance?
You’ll want to combine multiple confirmation signals when trading support and resistance levels.
Focus on price action patterns while analyzing volume and order flow for validation.
Watch for breakout strategy opportunities when price tests key levels, but don’t forget your trading psychology and risk management.
Pay attention to market trends and indicator alignment, as they’ll help you identify potential trend reversals.
When swing trading, always wait for clear confirmation before entering positions.
How to Use Resistance and Support Levels?
Start by identifying trends and drawing trend lines on multiple timeframes to spot potential support and resistance zones.
You’ll want to analyze price action and chart patterns while confirming levels with volume analysis.
Don’t forget to incorporate Fibonacci levels for additional confirmation points.
When trading breakouts, always implement strict risk management rules.
Remember that market psychology often causes prices to react at these levels, so watch for reversal signals before entering trades.
Do Professional Traders Use Support and Resistance?
Professional traders absolutely rely on support and resistance as core components of their trading toolkit.
You’ll find they integrate these levels with chart patterns, price action, and volume analysis to confirm entry signals.
They’ll use these levels alongside other trading indicators for trend analysis, while considering market psychology and sentiment.
What sets successful traders apart is their disciplined approach to risk management when trading these levels.
What Is the Best Timeframe to Trade Support and Resistance?
You’ll find the most reliable results trading support and resistance on H1 to D1 timeframes, where candlestick patterns and trend reversals are clearer.
While short-term trading on minute-to-minute charts can show intraday analysis opportunities, they’re often too noisy for consistent results.
Your best approach is to identify key levels on weekly charts for long-term trading perspective, then use daily fluctuations and hourly trends to time your entries, especially during periods of market volatility.