Let’s take a look at two currency pairs that were featured in my free weekly Forex setups. A blog reader has brought up some good things to talk about that could potentially help other users of the setups.
The first setup was in the EURGBP. This is the chart that I posted on Oct 29

The reader had written: “Looks good trade entry points when viewed on 4hrs – regular lower highs”
These types of trading setups can easily be traded by setting an order to short below the lows of the candlesticks for those looking for a more simplified approach.
Here is the four hour chart.

You can see that the breakout trade would have gone into profit but then profits would have evaporated. Traders may panic when they see that occur but the question you must ask yourself is: how is price pulling back?
Why ask that? Because you have traded the breakout and must now be on alert for a failed breakout. What do you consider to be a breakout failure?
- Is a retrace a failure?
- If price goes back inside the broken level, is that a failure?
I don’t consider a weak pullback after a breakout to be a failed breakout. Strong rejection of new prices? Different story. I’d consider that failed and will either tighten stops or exit – it’s all context related.
In this case, I consider the pullback to be a normal consolidation of price and it is of no concern. In fact, this type of pullback after a breakout is a good place to initiate a trade if you don’t play a breakout.
What about trading the pullback?
First off, this is a beautiful quiet pullback after a breakout – a normal evolution of price.
But what does a failed pullback look like? If you are playing the pullback, you MUST know what a failure looks like. A strong thrust against you, even after a quiet pullback, would be cause for concern and could be classified as a pullback failure.
In this case, everything was perfect but you have to know what the failure of these patterns look like.
EURNZD Setup
The other chart to look at is the EURO against the NZD where the person wrote: “I entered this one and it’s in profit, however, looking at the weekly chart there’s a large negative candle from last weeks close and a history of rejection near this level – would you normally carry on on the upside cautiously but watch the formation of the current weekly candle to confirm it’s safe?”

The answer is that the two weeks of rejection at highs, especially after the big green candlestick, point to more of a complex correction than a simple correction. Also keep in mind that, in general, you will have alternating simple and complex corrections.
Let’s take a look at the pullback before the strong push upwards and compare it to the one we have now.
You can see that the turning point consolidates before firing to the upside. This is a pattern that you really want to see when trading pullbacks. It can give you must better entries and depending on your entry style, can have you in profit quickly.
The current pullback is strong and as I wrote above, we don’t want a strong pullback.
For a pullback trade, where do we want to see strength? In the setup leg. Where do we see strength here?
In the setup leg PLUS the pullback leg.
This can lead to a complex correction. You could trade a short trade off of a weak rally and use a profit target of roughly a measured move (A-B=C-D)

For my money, I need an entry and I don’t generally play clean bounces off support/resistance. I like to see a break of support/resistance and then an immediate rejection of lower prices called failure tests. I infer a consolidation from the daily chart then drop down to lower time frames to find a thrust lower for a long trade and then price recapturing higher prices.
Although the yellow line contains most of the lows, the spikes lower are the same level but these are different from the failed tests I like to see.
To answer the question though….you can’t ignore the higher time frame but in the end, I am more concerned with what price is doing NOW. Is price showing an issue with the trade?
Big Time Trading Tip
If you have taken this trade long, look left and project right. You can drop to the four hour chart to see what this rectangle covers (I infer from this chart).
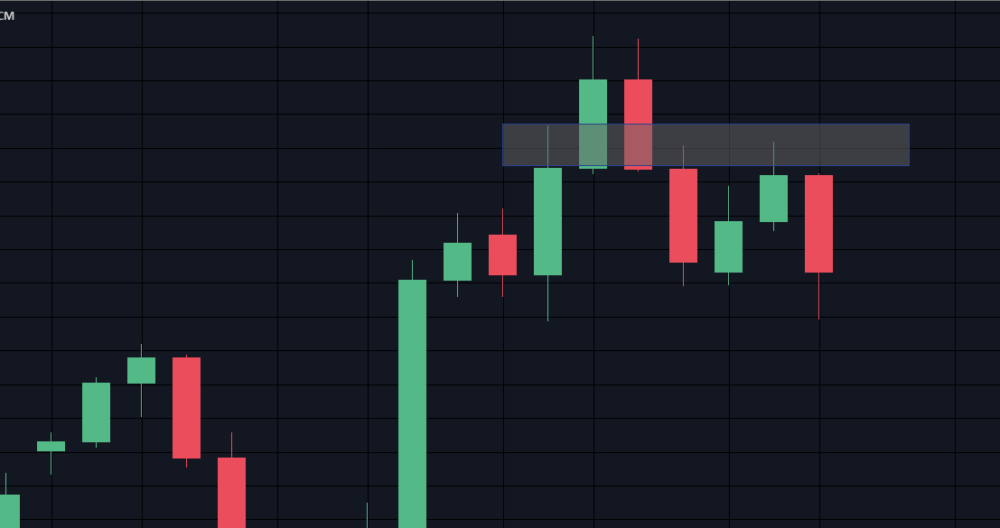
There was consolidation, a break out to highs, price plummets back through and tests the same consolidation zone from the other side. This must be a sign that any long trades are in trouble.
Go back through your charts:
- Find highs or low
- Look left to find consolidations just below for highs and above for lows
- Look to the right of the peak or valley to see what price does if it comes back to it.

Hope this helps and please share my work with others!