#2: GBPAUD SELL SETUP
- are you able to see the bearish harami pattern?
- breakout of the low of the inside bar may see price falling

#3: GBPCAD SELL TRADE SETUP
- can you see the bearish harami?
- breakout of the low of the inside bar may see price falling.

#4: GBPCHF SELL TRADE SETUP
- notice the inside bar?
- breakout of the low of that inside bar may see price falling.
#5: AUDNZD BUY TRADE SETUP
- watch that major support level for a bounce up

#6: NZDUSD SELL TRADE SETUP
- watch that upper channel trendline for bearish reversal candlestick pattern to go short.

#7: EURJPY SELL TRADE SETUP
- watch to see if price heads up and touches the falling trendline and sell if you see a bearish reversal candlestick pattern.

#8: GBPAUD SELL SETUP
- notice the bullish harrami pattern?
- if the low of the inside bar breaks, expect price to fall.

That’s it for the week. Don’t forget to share, tweet etc.
Forex Trading Signals For 29th Aug-2nd Of Sept
#1: USDJPY SELL SETUP
- trendline setup on the daily chart.
- if trendline breaks, use trending breakout strategy for (2) situation.

#2: USDCHF SELL SETUP
- trendline setup on the daily chart.
- if trendline breaks, use trending breakout strategy for situation (2) & (3) to buy.

#3: USDCAD SELL SETUP
- trendline setup on the daily chart.
- if trendline breaks, use trending breakout strategy for situation (2) to buy

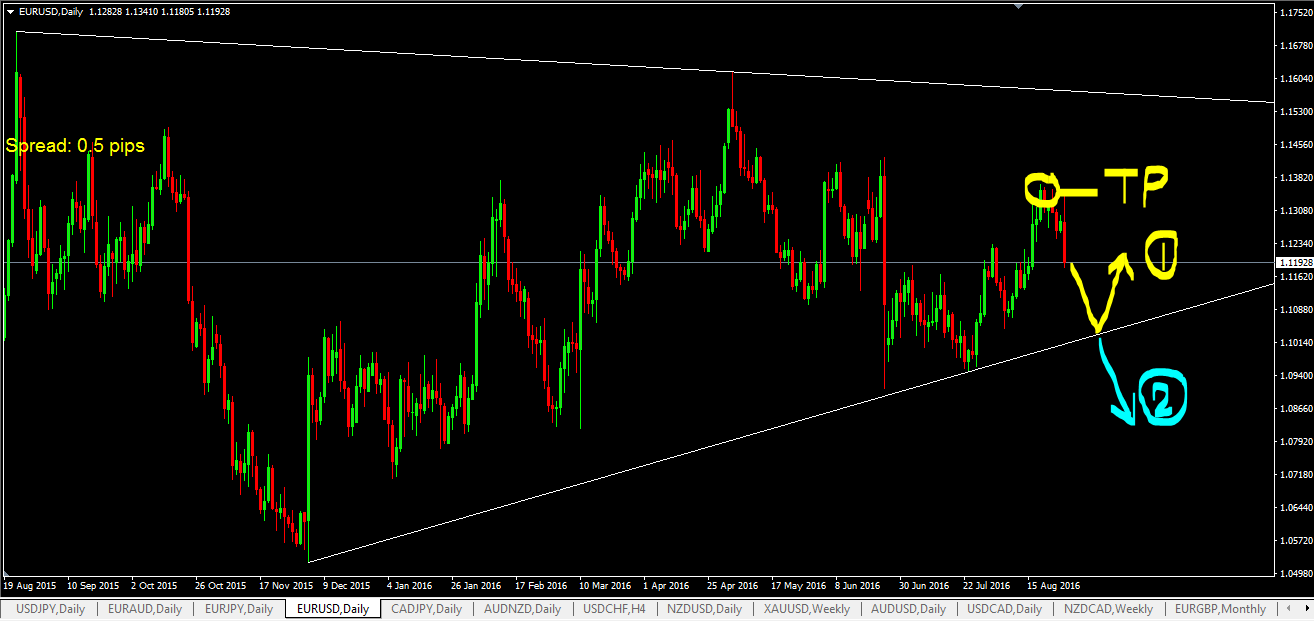
#4: EURUSD BUY SETUP
- trendline setup on the daily chart.
- if trendline breaks, use trending breakout strategy for situation (2) to sell.
#5: EURAUD SELL SETUP
- trendline setup on the daily chart.
- if trendline breaks, use trending breakout strategy for situation (2) to buy

#6: NZDCAD SELL SETUP
- trendline setup on the weekly chart.
- switch to daily, 4hr or 1hr for trade entry using multiple timeframe trading
- if trendline breaks, use trending breakout strategy for situation (2) and (3) to buy

#7: AUDNZD BUY SETUP
- support level setup on the daily chart.
- if support level breaks, look to sell.

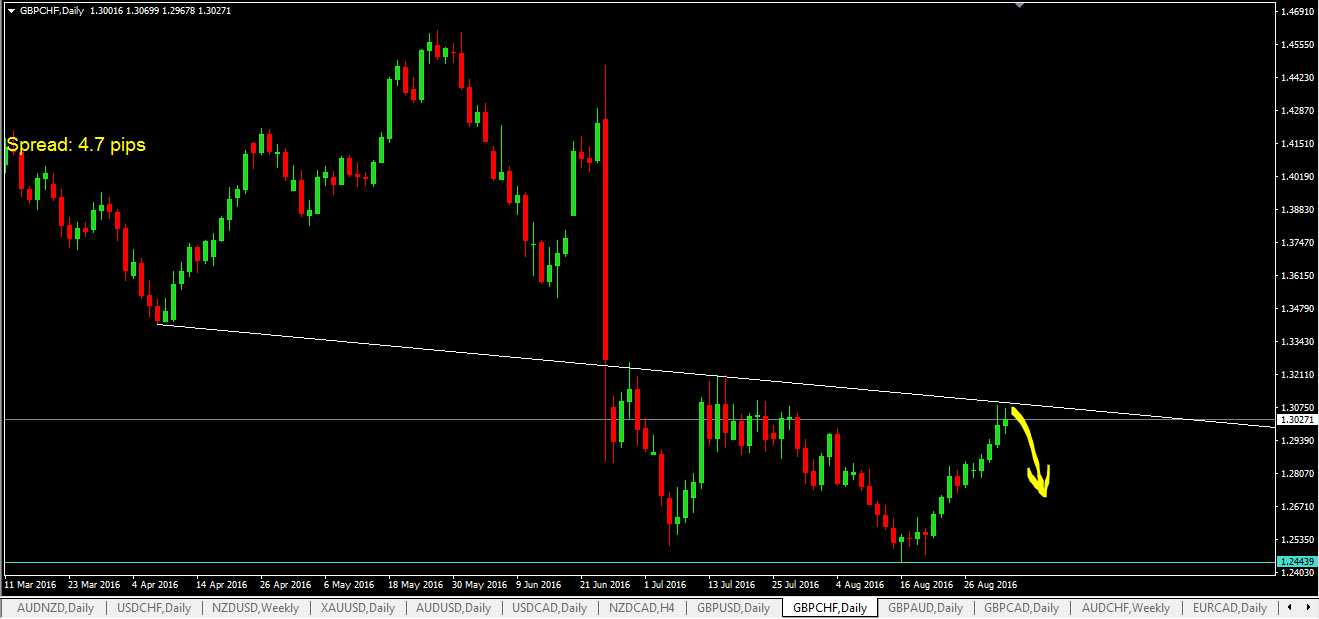
#8: GBPCHF SELL SETUP
- trendline setup.
- look to buy if trendline is broken

#9: GBPAUD SELL SETUP
- trendline setup.
- look to buy if trendline is broken

#10: GBPCAD SELL SETUP
- trendline setup.
- look to buy if trendline is broken

#11: CADJPY SELL SETUP
- trendline setup.
- look to buy if trendline is broken

#12: XAUUSD BUY SETUP
- trendline setup.
- look to buy at (1) and if that is broken, look at support level at (2) to buy.
- look to sell if trendline is broken at (2) and support level is broken at (3).

That’s it for the week. Please share, tweet, mention these free price action forex trading signals to other traders who may be interested.
Forex Trading Signals For 22nd -26th August 2016
#1: EURAUD Potential Sell Trade Setup
- note the resistance levels shown below on the daily timeframe.
- price is now near it.
- look for bearish reversal candlesticks in the daily, 4hr or 1hr timeframe to sell.
- if that resistance levels fails, next thing to watch will be the falling trendline

#2: USDJPY BUY TRADE SETUP
- note the obvious support level on the daily chart?
- price is just close it to it now.
- look for bullish reversal candlesticks in the daily, 4hr or 1hr to buy.

#3: NZDUSD SELL TRADE SETUP 4hr TF
- note that this setup is happening on the 4hr timeframe
- if price goes up and touches that falling trendline, look for bearish reversal candlesticks to go short in the 4hr TF or 1 hr timeframe.

#4: XAUUSD BUY TRADE SETUP 4HR TF
- GOLD is still finding support from that rising trendline as shown in the 4hr timeframe.
- watch to see if price goes down again and touches that trendline.
- if that happens, bullish reversal candlesticks in the 4hr or 1hr timeframe should be your buy signal.

#5: USDCHF SELL TRADE SETUP 4HR TF
- watch to see if price comes up and hits the previously broken support levels.
- then look for bearish reversal candlestick patterns to sell if that happens.

Forex Trading Signals 15-19th August
- There are 7 forex trading signals to watch this week.
- all explanations written on the charts.
- use multiple timeframe trading technique if you want early trade entries.
- use pending buy stop or sell stop orders.
- take profit levels have been suggested for you or use risk:reward of 1:3
- stop loss placement suggestion:whatever the reversal candlestick “signal” that resulted in your pending order being activated, place your stop loss a few pips above the high/low of the signal candle. Spreads must be considered when placing these stop loss. Or if there is a nearby swing high/low where you can place your stop loss, then use that.
- this method can also help you: patterns in a pattern (advanced multiple timeframe trading techniques)
#1: EURUSD Trading Signal (Sell Setup)
 #2: USDCHF Trading Signal (Buy Setup)


#3: USDCAD Trading Signal (Buy Setup)

#4: NZDUSD Trading Signal (Buy Setup)

#5: GBPCAD Trading Signal (Buy Setup)

#6: GBPCHF Trading Signal (Buy Setup)

#7: GBPUSD Trading Signal (Buy Setup)

Forex Signals For 8-12th August
- There are 7 price action trading setups for you. Click “Next” button below to check them out.
But first, lets check out the forex trading signals performance for 1st-5th August. How Did price respond? Lets See…
Forex Trading Signal Performance Reviews 1-5th July
There were 9 price action trading setups given. Of these:
- 5 trade setup did not happen and these setups are still valid and can be watched this week.
- the 4 other setups happened but 3 of these trade setups happened as anticipated and price responded well but later the price changed direction and if you traded these setups, you’d most likely walk way with little profit if you moved your trailing stop quickly to lock in some profits but if you were looking for bigger profits above 50 pips, you’d most likely suffer loses.
- only one trade setup was perfect…a bullish harami formed on the trendline and price shot up by 177 pips.
Full details of each of these trade setups are given below.
#1: SELL TRADE SETUP NZDCAD REVIEW
- setup yet to happen.
- something to watch next week.
#2: EURJPY BUY TRADE SETUP REVIEW
- price responded as anticipated but the upward moves was not sustained.
- price moved up from the trendline by at least 50 pips before falling back down and intersecting the trendline.
- if you traded the 1hr or the 4hr chart and applied trailing stop, you cold have made some profits of that 50 pips move

#3: CADJPY BUY TRADE SETUP REVIEW
- price responded as anticipated but the moves was not sustained.
- If you were watching in the 1hr or 4hr, there were buy signals you could have taken on this trade setup.
- but the move was not sustained, price moved up 30 pips and then fell back intersecting the trendline and heading down.

#4: AUDUSD SELL TRADE SETUP REVIEW
- trade setup is yet to happen.
- something to watch next week
#5: NZDUSD SELL TRADE SETUP REVIEW
- setup is still valid and yet to form
- something to watch next week
#6: AUDNZD BUY TRADE SETUP REVIEW
- price responded as anticipated but the move was not sustained but some time later, price changed direction and shot up.
- as you can see below, price hit the support level identified but went below it by at least 70 pips before turning back and shooting up by 150 pips.
- if you were watching the daily chart, and traded the breakout of the high of the doji candlestick, you would have made money on this setup.
- trading in the 1hr or 4hr would have turned into a loss if you were looking for a lot more profit than the 30 pips move.

#7: EURUSD sell Trade Setup REVIEW
- setup did not happen and it is still a valid setup to watch next week.
- something to watch next week
#8: USDCAD BUY TRADE SETUP REVIEW
- a really good trade setup…trade setup happened on the first trendline I mentioned.
- if you were watching on the daily, you would not get a good buy signal
- but if you were watching in the 4hr timeframe, you’d get a good buy signal, a bullish harami and you would have made money on this setup.

#9: USDCHF BUY TRADE SETUP REVIEW
- trade setup did not happen and is still valid
- something to watch next week
7 Forex Trading Signals / Trade Setups To Watch For 8-12th August
There are 7 trade setups to watch this week. The charts are self explanatory. Any confusion, leave your questions in the comment section so that I can reply.
#1: AUDUSD FOREX SIGNAL
- price is still travelling inside the two trendlines shown below.
- As a matter of fact, this is a symmetrical triangle chart pattern setup that is happening so anticipate a breakout or if a breakout does not happen, price may obey those two trendlines for a while until the breakout happens.

#2: CADJPY FOREX SIGNAL (BUY SETUP)
- notice below that there is an obvious support level.
- if price reaches that, expect a bounce up if you see bullish reversal candlestick patterns form.

#3: EURAUD FOREX SIGNAL (BUY SETUP)
- notice the support level below?
- if price hits it, watch to see if you see any bullish reversal candlesticks patterns from there and that should be your trigger to buy.

#4: EURUSD SIGNAL
- this is symmetrical triangle chart pattern forming here.
- sooner or later, price will breakout of this pattern and if it does, you can use the trendline breakout forex trading strategy to trade it.
- but if it is still going to obey the trendlines, use the trendline trading strategy.

#5: NZDCAD FOREX SIGNAL (SELL SETUP)
- setups like these have the potential to move 1000 pips plus.
- the chart below is based on the weekly chart but I suggest waiting in the daily, 4hr or 1 hr timeframe to look for bearish reversal candlestick signals to sell if price reaches wither the trendline or if that trendline fails, the major resistance level.

#6: USDCAD FOREX SIGNAL
- if price goes up and hits that upper trendline, watch for bearish reversal candlestick patterns to go short (sell).

#7: XAUUSD SIGNAL (BUY SETUP)
- this is a 4hr chart of XAUUSD and as you can see price has responded to the trendline and fromed a doji cross, a good reversal signal.
- if the high of the doji is broken, expect price to move up.

Ok, traders, that’s it for this week. Wish you many pips! Don’t forget to share, like, tweet or tweet these free forex trading signals to your friends and fans.