Skip to content
Home » Forex Trading Signals Archive » Page 12

Forex Trading Signals Archive

 Review Of Last Week’s Forex Signals (25th-29th July)

Here’s a quick summary  but more details are given below this.

There were 6 forex signals/setups given last week:

  • two losing trade setups
  • 1 setup did not happen
  • 3 winning trade setups
  • total pips move for these 3 winning setups, 1,060 pips.

Now, here are the full details…

#1: Forex Signal Review CADJPY Buy Setup

  • price hit support level but failed to respond as anticipated.
  • there was a buy signal in 1hr time frame but not in the 4hr and the daily.
  • a losing setup if you took a trade in the 1hr timeframe.


forex trading signal review CADJPY

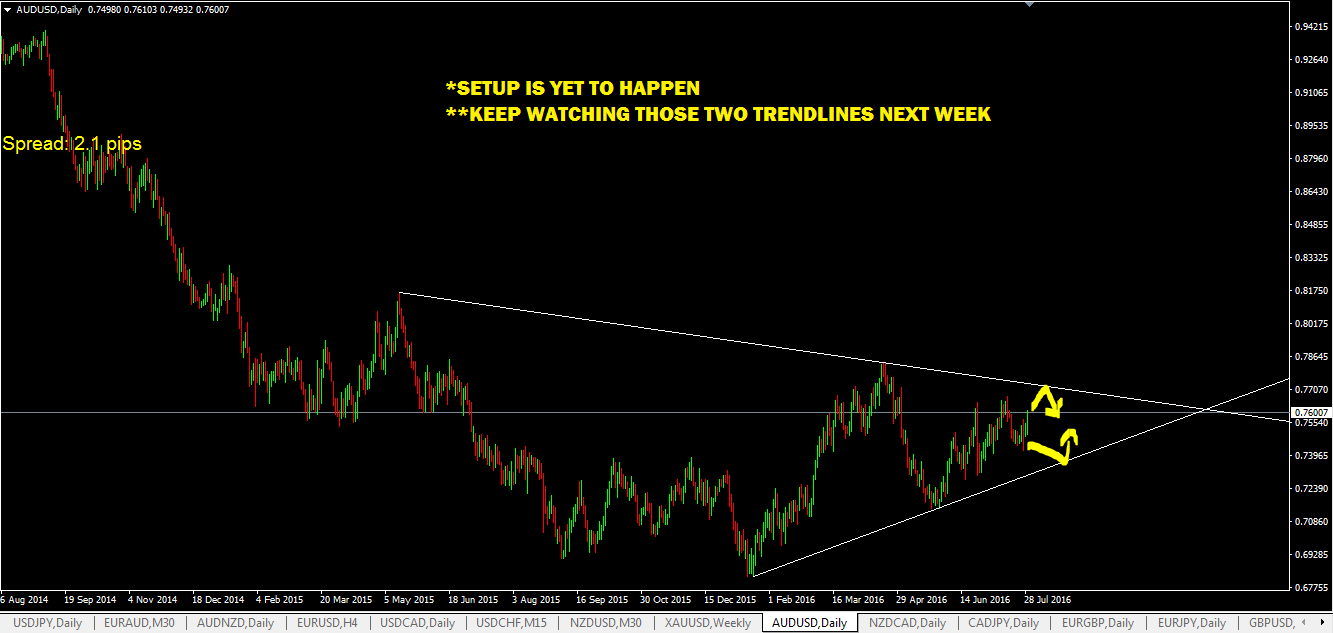
#2: AUDUSD Trading Signal Review

  • setup is yet to happen
  • this is one setup to watch out for next week as you can see now price is a bit closer to the upper trendline so watch that space for sell signal if price hits that upper trendline!

Forex Trading Signal Review AUDUSD


#3: USDCAD Forex Trading Signal Review

  • if you were watching this setup to trade it, either in the daily, the 4hr or the 1hr, there were more than enough sell signals in all these timeframes for you to see and sell.
  • this is a winning setup and price moved down a max of 210 pips after hitting the upper channel trendline.

forex trading signal review USDCAD


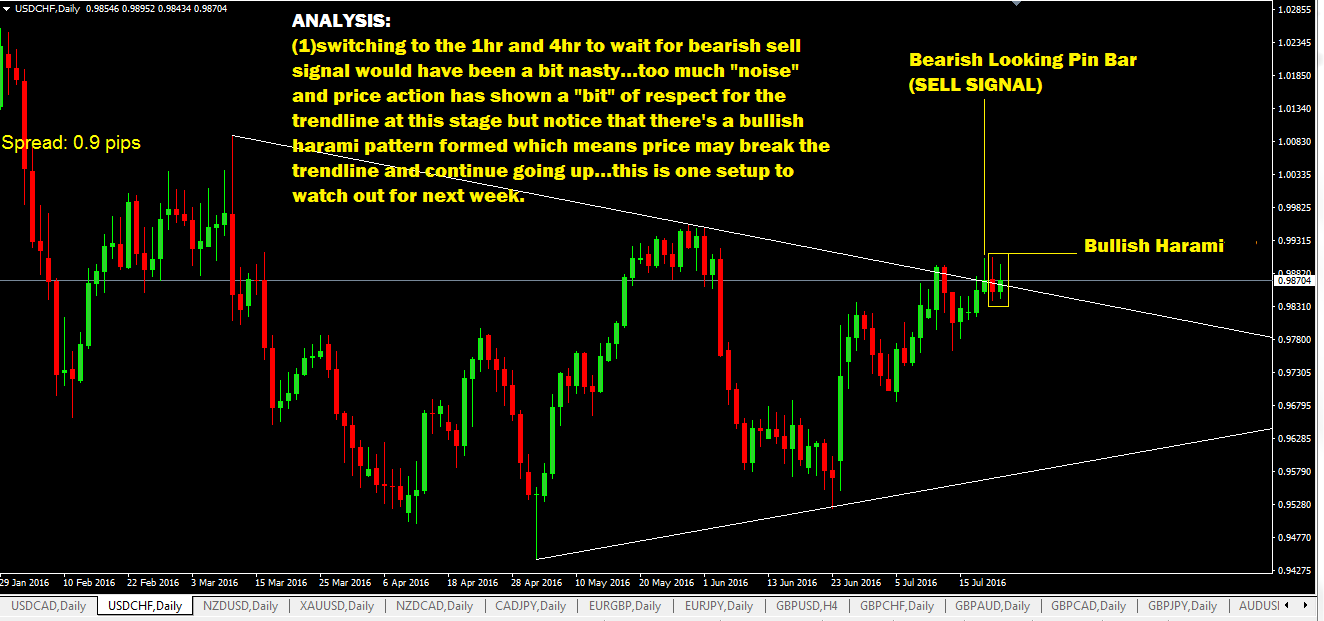
#4: USDCHF Trading Signal Review

  • setup happened as anticipated BUT after the big upward candlestick spike ( a false trendline breakout/bull trap maybe??)
  • this spike would have taken you out of a sell trade with a loss so it is a losing setup.
  • but if you traded the breakout of the low of the bearish candlestick after the spike, you would have made some profitable pips as you can see, price moved down a total of 280 pips.

***”falls” below  on the chart means “false”…just my typo…It should not be hard to figure it out I guess 🙂

forex trading signal review USDCHF

#5: USDJPY Forex Signal Review

  • if you notice below, there are two arrow…these were 2 great opportunities for you to sell and represent 2 times price went back up to test the trendline and failed.
  • price moved a total of 470 pips from the first sell opportunity.
  • there were good sell signals shown in the 1hr and 4hr timeframe if you were watching in those timeframes.
  • even the sell signals on the daily were good to take and you’d have made money regardless if your stop loss were placed a few pips above the high of those daily candlesticks.

Forex Trading Signal Review USDJPY

#6: XAUUSD Trading Signal Review

  • Last week, I told you I was bullish on this setup even though it was revealing a bearish harami pattern.
  • if you look a the chart below carefully, right after that, there was a bullish harami pattern. Price took off after that.
  • switching to the 4hr and even the 1hr would have given you good buy signals.
  • price moved for a maximum of 380 pips up from that support level.

XAUUSD trading signal review

 Forex Signals (1st-5th August)

There are 9 forex trading signals/setups to watch out for this week.

#1: SELL TRADE SETUP NZDCAD  (NOTE THE WEEKLY TIMEFRAME)

  • Price may head up and touch the falling trendline or if that trendline fails, watch that major resistance level at 0.9650
  • use multiple timeframe trading technique for trade entries, which simply means you switch down to a much smaller timeframe like the 4hr or 1 hr and wait there to see if your spot any bearish reversal candlesticks to sell.


NZDCAD forex trading signal 010816

#2: EURJPY BUY TRADE SETUP

  • keep an eye on that rising trendline as price may go down and hit it and bounce up.
  • look for bullish reversal candlestick signals on the daily, 4hr or 1hr as your signal to buy.
  • if that trendline fails, next level to watch will be the support level below in drawn in the pink line. Watch for “bounce up” from there as well

forex trading signal eurjpy 010816

#3: CADJPY BUY TRADE SETUP

  • note that this setup is happening in the 4hr timeframe.
  • price is just near that rising trendline so you need to watch to see if price hits and creates some bullish reversal candlesticks for you to go long(buy)
  • If that trendline fails, the next level to watch will be the support level at 76.05 shown by the pink line below. Watch for bullish reversal candlesticks there to buy if that happens on that support level as well.
  • consider switching down to 1hr timeframe to look for bullish reversal signals there…you may find a good entry there.

CADJPY forex trading signal 010816


#4: AUDUSD SELL TRADE SETUP

  • right now, price is much closer to the upper falling trendline than the lower one so there’s a great chance of a sell setup happening.
  • this is daily timeframe so switch to 4hr or 1 hr to watch there as well. You may see some early sell signals in those lower timeframes.

Forex Trading Signal AUDUSD 010816

#5: NZDUSD SELL TRADE SETUP

  • price may head up and hit the upper channel trendline.
  • switch to 4hr or 1 hr timeframes to look for bearish reversal candlesticks to sell

forex trading signal NZDUSD 010816


#6: AUDNZD BUY TRADE SETUP

  • this is a resistance level turned support level situation happening and you can see the Friday’s candle tail has hit that level and bounced up.
  • look for bullish candlesticks in the daily, 4 hr or 1 hr to go long

forex trading signal EURAUD 010816


#7:  EURUSD sell Trade Setup

  • watch that falling trendline if price gets up and hits it, look to sell.
  • switch to 4hr or 1hr timeframes and see if you can spot bearish reversal candlestick to sell.

forex trading signal EURUSD 010816


#8: USDCAD BUY TRADE SETUP

  • there are 2 trendlines to watch on this setup. if trendline 1 fails, then watch trendline 2.
  • switch to 4hr or 1 hr to look for bullish reversal candlesticks to go long.

forex trading signal usdcad 010816


#9: USDCHF BUY TRADE SETUP

  • if price goes down and hits that rising trendline, look for bullish reversal candlesticks to buy.
  • you can also switch to 4h or 1 hr timeframes to look for bullish reversal candlesticks to get a much earlier entry instead of waiting for the daily timeframe.

forex trading signal usdchf 010816

Ok, traders, that’s all for this week and many pips to you!

 Review Of Last Week’s Forex Signals (18-22nd July)

I guess I better start reviewing the previous week’s forex trading signals as well and then put up the new signals for the coming week.  I sort of stopped doing that because I was assuming that it is very easy for anyone to go and check for themselves but after thinking about what Richard said, I’ll start doing it again. (Thanks Richard!)

For me is really easy to do that but for some of you who are new to all this, it will take a while.

forex trading signals reviews

#1: AUDUSD forex trading Signal Review

  • setup did not happen but it is still valid for next week.

forex trading signals review AUDUSD

#2: EURCAD forex trading Signal Review

  • setup did happen
  • you would have made money on this setup if you were watching in the 1hr and or the 4hr timeframe as there was a bullish harami candlestick pattern on the 4hr for the buy setup.
  • and if you were also watching the trendline above, as soon as price hits it, it formed a nice bearish pin bar in the 1hr timeframe and after that, price moved down by 111 pips. (Your homework…open up 1 hr chart and see what I’m talking about here)

forex signal review EURCAD

#3: Forex Signal Review CADJPY

  • Setup did happen
  • you would make money on this setup if you placed stop loss a bit further away as shown on chart below.
  • Thursday’s candle spike would have knocked out the stop loss just placed behind the high of the inside bar.

forex trading signals reviews CADJPY

#4: Forex Signal Review USDCHF

  • setup  did happen but it was a bit “messy” in the 1hr and the 4hr timeframe if you were trying to trade from those timeframes and most likely you would have suffered a loss if your stop loss was placed too close.
  • on the daily timeframe, it looks much cleaner but there’s a bullish signal being generated as shown below so price may move up further next week.

Forex Signal Review USDCHF

#5: Forex Trading Signal Review EURAUD

  • setup did not happen…but still valid setup to watch for. i don’t think it will form next week so it will be omitted from next week’s signals until such time I see price getting near to the support level.

forex signal review euraud


#6: GBPJPY forex signal REVIEW

  • setup did not happen…still pending and valid setup to watch next week too.

forex trading signal review GBPJPY

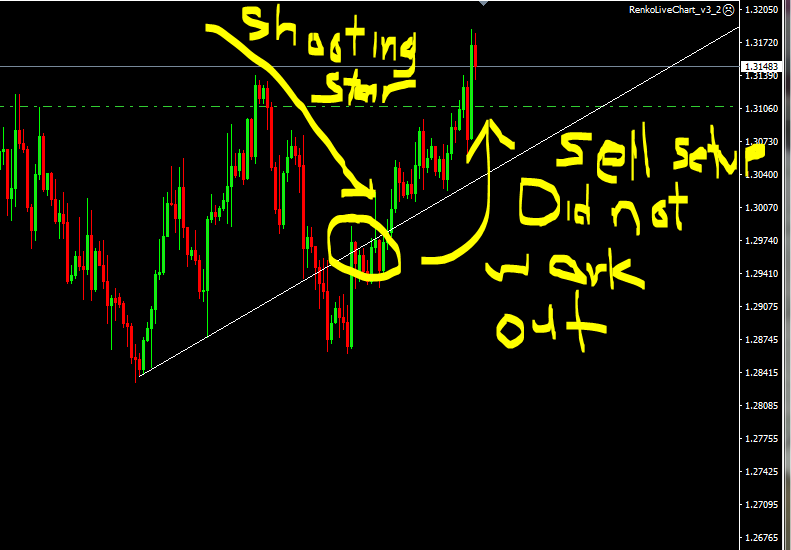
#7: USDCAD forex Signal REVIEW

  • this setup was a broken trendline retest for a sell setup. there were at least 2 sell signals in there as yo u can see on the chart below but those did not work out.
  • if you sold on the shooting  star, you would have made money if you took some profits off but notice later price shot up.

forex signal review usdcad


#8: USDJPY Forex Signal Review

  • Setup happened as anticipated and you would have made money on this setup.

forex trading signal review USDJPY


#9: XAUUSD Buy Signal Review

  • setup did not happen as I anticipated based on the bullish pin bar that formed last week.Gold has gone down again to the 1300 major support zone/level and tested it for the 2nd time and price action is showing a STRONG bounce up from there based on Thursday’s candlestick.  Even though, Friday’s candlestick with Thursday’s candlestick form a bearish harami pattern,  I’m still bullish on this one unless that support level zone on 1300 get broken and price closes below it.
  • this setup is still valid to watch out for next week as well.

forex signal review xauusd

The  following are  forex signals and trading alerts based on price action trading for:

  • this week, 25th -29th  July 2016
  • I got 6 forex trading signals (trading setups/ alerts) for you to watch

Click the “Next” Button Below To Go And Find Out About This Week’s Forex Signals /Trade Setups Alerts To Watch Out For.

Pages: 1 2 3 4 5 6 7 8 9 10 11 12 13

74 thoughts on “Forex Trading Signals Archive”

  1. Hi Rkay,
    Thank you for your weekly signal. Do you see there is a Head and Shoulders pattern in NZDUSD Daily Chart? Do you think it could be a breakout of the neckline of Head and Shoulders instead of reversal of the channel?

    1. Hi Peter,
      good pickup there…Yes. the neckline has already been broken and looks like it is retesting it. May have to switch to sell mode if you see a bearish sign there.
      Also with the talk on increasing interest rate in US next month, expect more more downward move on this one.

      Regards

      RKay

  2. Hi RKay,

    Saya sayang beruntung bisa menemukan Web mu, karena bisa belajar lebih jauh lagi soal TrendLine dan Price Action. Website mu sangat edukatif dalam dunia Forex, smoga web ini slalu jaya.

  3. Hi RKay, are you using the same signals in your live accounts? You have demonstrated several strategies in your articles, are you using the same strategies in your live trading? Thank you for creating this site. It is helping me a lot.

    1. Hi Richard,

      (1)yes, whatever signals I post, I watch them to trade as well.
      There will be occasions where I tend to miss trading signals because of my day job or I may be asleep when setups form and I would miss trading them and that kind of sucks. But hey! That is something traders like me that have day jobs and trade on the side have to put up with I guess.

      (2) the strategies I use most are mentioned on the “forex signals page” in the beginning of it. As you can tell, there are hundreds of strategies on this site so traders can find what they like and test them out see what fits their personality and stick with them or not. Its entirely up to each one.

      Regards

      RKay

  4. Hi Peter,

    If you are having difficulty to upload images, shoot me an email at rkay[at]forextradingstrategies4u.com and attach the image with your questions/comments and I’ll upload them on my end and answer etc…

    Regards

    RKay

  5. On this week signals, i saw GBPUSD as a side channel not an asymmetric triangle… and it turned to be truth!. I saw i at the beginning of the week when i saw your signal but didn’t comment. If there are these situations where 2 or more patterns are possible, i try to take both in mind, but obviously with so many pairs to analyze you can miss something.
    I love your posts, great work, and thank you for being so cool!.
    If i can help with some observation next time i will comment earlier and do not wait until the end of the week jajajaja.
    Have a nice sunday!.

    1. You have an excellent and a very valid point there Sebastian about “where 2 or more patterns are possible, i try to take both in mind.”

      Believe me, You see this happening every time.

      For example, A trendline trading setup is also a trendline breakout trading setup.
      How?
      If trendline setup does not work because the trendline is broken then switch to using the trendline breakout setup.

      LOOK AT ALL THE POSSIBLE SETUPS THAT CAN BE THERE…SO IF ONE FAILS OR DOES NOT HAPPEN, LOOK AT THE NEXT ALTERNATIVE.

      That’s how I trade.

      Regards

      RKay

  6. Like Isabelle said your blog is tremendously valuable and honest which is a rare thing in this industry especially from the education point of view.

    What I want to ask is how can I train my EYES to trading setups regularly viewing past and current price action ?

    Peace and blessings.

    1. Hi Sadio,

      there are no well defined rules but for my case, this is how it happened:
      (1) spend more time in front of charts studying the past data. I spent thousands of hours looking at past price action, studying them and seeing how price moved in the past because of support or resistance levels, or trendlines or channels etc. The more I looked at what happened in the past, the more I can see what is happening in the present and see the price patterns unfold and as a result ANTICIPATE what the likely outcome of a trading setup is going to be.
      (2) at its core, price action is about support and resistance levels, which are swing highs, swing lows. All price patterns are built around support and resistance concept: sysmmetrical triangle, double top, double bottom, wolfe wave etc…
      (3) to speed up your process, regularly follow my forex trading signals and try to understand the process involved there.

      Cheers

      RKay

  7. Hi RKay,

    Your blog is a treasure chest of knowledge. Simple and very easily understood. You could turn your blog into a book. Your blog sure beats a lot of books in the market. Keep up the good work.

    Loyal follower.

    Isabelle

    1. Hi Isabelle,
      Glad to have a lady trader on board! Awesome!
      Too much work for a book though…but with blog like this, I have the freedom to write about anything trading related that I’m interested about without any “RIGID” structure in place like in a book.

      Cheers

      RKay

      1. I have to agree with Isabelle this blog is not only valuable but honest which is a rare thing in this industry especially from the educational point of view.

        What i want to ask is how can I train my EYES to spot trading setups regularly I’ve read your article on patterns within a pattern and Find it tremendous.

        Peace and blessings.

  8. Hi Rkay,

    Is it ok to ignore the Brexitcandle when drawing a trendline? As you did in the GBPCAD setup e.g.?
    Your trendline does make sense. The brexit candle is such a rare candle that maybe it’s best to ignore it.
    or not?
    Thanx for your helpful site

    1. Hi Peter,

      how have you been doing?

      Yes, you can ignore the “brexit candle”. As you’ve noticed, this is NOT A NORMAL TRENDLINE SETUP because the trendline cuts through the brexit candle.
      Now, I’ve traded these kinds of setups before and these setups do work and they do not occur frequently, pretty rare or once in a while they do form.
      The secret is to watch for the formation of reversal candlesticks when price touches that trendline and used pending buy stop/sell stop orders to place under the high/low of that “SIGNAL REVERSAL CANDLESTICK” and if the high/low is broken on the next candle that form, then chances are the setups is going to work out.

      But having said that, sometimes, they may not work out. But the biggest factor to watch is reversal candlesticks.

      RKay

  9. Well hello there Rkay hope you are having an amazing day I’m justing vibing and enjoying some time as I type this. Taking back some of your feedback and criticism on confluence I’ve decided to analyze and identify some good setups and take some of things you’ve told me in consideration !! Here it is:

    Confluence of Trend line + Fib level and bearish Harami.
    Pair: EUR/USD
    Time Frame: Daily
    Falling trend line with Three connects . Swing high point can be identified at 1.6125 and last connect at around 1.3543
    Fibonacci swing point High = 1.16134
    Fibonacci swing point Low = either 1.09521 or 1.09103
    Bearish Harami can be found at 0.618 fib level which intersects with the falling trend line.

    So far so good I’m in a profitable situation. Thank you so much and Feedback would be greatly appreciated. One love.

      1. Hello Rkay, I apologize for my mistake I was too exited for the feedback lol. What i was supposed to type was 4hr time frame. The levels i;ve mentioned are for the 4HR Time frame.

        Feedback would be greatly appreciated and once again I apologize.

        1. Hi Johnn,
          I don’t even see any setups based on trendlines even in the 4hr TF.
          Price is way off from any trendlines, even in the 4hr TF.
          Maybe you are drawing your trendlines wrong or looking at things a bit differently but i just dont see any setup at all that makes sense in the 4hr timeframe.

  10. First and Foremost i would like to say THANK You! You are one of the very few people in forex i know that provide excellent training, support and encouragement to your amateur traders (lol we all start from somewhere. ) I have gained further knowledge but most importantly confidence which I believe is the most important aspect in trading.

    Im here analayzing USDJPY and I’ve noticed a head and shoulders pattern formed at a support line. With mutiple time frame analysis (something Im currently trying to master ) what time frame would you recommend to get better and quicker profit ?

    Once again, thank you I really appreciate everything !

    1. Hello Mohamed,

      with multiple timeframe trading, the main thing is about finding “which timeframe gives the buy/sell signal”. That’s why you switch betwn different timeframes to look for that.

      Why is that?

      Well for example: if you were watching a setup in a daily timeframe, you will miss the buy/sell signal in the 4hr because the daily timeframe is large and it COVERS that signal.

      Or the opposite can happen: there won’t be any buy/sell signals on the 1hr/4hr timeframe etc but you notice a buy sell signal on the daily.

      So really, it is not really about what is the best timeframe, it is about what timeframe gives the buy/sell signal.

      1. Thanks Rkay for your website. I’ve noticed a bearish harami form on the daily EURUSD CHART with a confluence of a downward trend line.

        Also As feedback, I’ve drawn a fib retracemtent level from 1.16150 as swing high and swing low at 1.09521 which is where a bullish hararmi was also found !!! Is that correct procedure in drawing fib levels.

        Thanks feedback would be greatly appreciated.

  11. Hallo RRay,

    Can you please tell me how you draw those yellow arrows on your charts? is it some special software?
    Im looking for a tool like that and it’s probably not in MT4 is it?

  12. I impressed with the quality of information provided here. Your approach to explain Forex strategies is quite simple and instructive for every cadre of traders.
    Good work RKay

  13. RKay

    I received your update on the AUDUSD
    First I would like to commend you on the SUPERB website and on the quality of the material
    In addition to pure price action I use Murrey Math lines (MML) for knowing significant pivot areas as well as future price direction (see attached image)
    It looks to me that the AUDUSD will try to test the 0.78125 price level
    Regards,
    Nathan

    1. Hi Nathan,

      there’s a previous swing high price level 0.7834 which may provide resistance if those two trendlines fail.
      That is something to watch as well.

      Thanks for your comment.

      Cheers

      RKay

    1. Hi Dennis,
      I don’t know what you are seeing but price has a fair bit of move to go before it touches that rising trendline drawn in the 4hr timeframe.
      Any bullish signals generated before that happens is IRRELEVANT in the context of this setup.

      Cheers

      RKay

  14. I use the same approach to find setups as you do Rkay, mostly trendlines, horizontal and patterns. Its funny how you sometimes draw lines and then Im like hey why didnt I see that one, haha. Your analysis is a great addition to my own. Tnx for posting your charts, keep it up 😉

  15. G’day RKay,

    Absolutely fantastic site, congratulations.

    After spending two years in search of the “Holy Grail” indicator, researching, studying and the like (believe you me, I did the hard yards), mate, your teachings have brought me back to basics, and re-opened my eyes…………Price Action, S/R, Trendlines (which I initially disregarded, as I was convinced the magic indicator was out there)……….just like the way it was done by eye and hand prior to computers.

    Fortunately I have been round the block, so this time round (especially with your solid explanations and guidance) it is a lot easier for me too grasp and understand completely.

    Thank you for your relentless, unselfish willingness to help all aspiring traders out there, may you forever stay blessed.

    BKay

  16. USDCHF July 24

    RK On the USDCHF H4 it is forming a triple top
    How does that corroborate with the Bullish Harami on the D1?

    mY QUESTION IS WHEN U HAVE CONFLICTING DATA WHAT DO U NORMALLY DO?

    1. Hi Natig,
      short answer to what I normally do, whichever level/line etc price hits first and display bullish/bearish reversal signal etc, take the trade based on that.
      sometimes, you may have suffer one or two loses before eventually market goes as expected.

      Cheers

      RKay

  17. Hi sir, do you also do a review of what happened of your posted signals from previous week? It would really help if you give a review of what happened. Waiting for this wk’s signals. Thanks a lot. More power!

    1. Hi Richard,
      I kind of stopped doing that-giving a review of last weeks signals because I’m assuming that every trader who is keen on following the free forex signals/setups/alerts should do it themselves because its not that I don’t want to do it, its because you’ve got to take the time invest in yourself to study that prediction and what the outcome of the signals were.
      It is a really simple process:
      (1) what initial trade setup/signal was…that would be charts I’d give with trendlines, support resistance etc that I give on the weekend.
      (2) the end result: has price responded as anticipated or not?

      All you need to do is pull up the recent chart and compare WHAT WAS THEN (my signals/setups) and WHAT IS NOW (did price responded as predicted? any reversal candlestick clues? how many pips did price move etc…)

      That’s how I learnt price action trading…

      Cheers

  18. I’m 100% price action trader, I do not trade based on fundamentals. The only thing is before I place a trade I make sure I check forexfactory calendar to make sure that I’m not entering a trade at a time when a major news is just about to be announced.

  19. Hi sir, I just landed on your site and really is informative and best thing its free! I really admire people who share their key knowledge without expecting anything in return. I will apply your weekly signals into my account until I am able to analyze the signals on my own. Hope you can continue to update w/o fail as long as it takes. Thank you a lot for this. Got some few questions. 1)Since you are looking in a large timeframe, you are considered as a swing trader, right? 2)How do you set your lot size for every trade?

    1. Keep reading and increasing your knowledge and SPEND A LOT OF TIME LOOKING AT CHARTS, that’s the only way you begin to understand price action.

      Price action is not the holy grail. It has it strengths and weakness. The key to trading price action is finding areas/levels/zone on your chart where the chance of a trade is going right is high.

      And once you’ve identified that setup/level/zone/ etc, then look for the trigger…the trigger is often a single reversal candlestick or a combination of two or three candlesticks, for example, the bullish harami pattern.

      Many pips to you.

    1. Hi Thulisile, I do not provide such nor do I have any intention of doing that. You can learn most of the forex trading stuff here free and really there’s nothing new.
      If you are interested in price action trading, the price action trading course is in here for free and on top of that, there’s the price action forex signals so what you learn in the price action trading course is applied in real time on the price action forex signals.
      Just take your time to learn and study and see how price behaves etc.

  20. Thank you Rkay, I will wait for this newly formed candle to see if it closes above or below the upward trendline, but on the M15 chart it shows that it will go down.

  21. YES if you have drawn a trendline as shown in the attachment below. You can see that the bounce UP from the trendline has already happened.
    If you were watching this setup in in the 15 minute timeframe using the multi timeframe trading technique, there was a really good buy signal

    Note also that the length of the 4hr candlestick is too long already so if you were to place a buy stop on the breakout of the high, your stop loss distance would be huge.
    I’d wait to see if price falls down a bit again toward the trendline and if a bullish candlestick forms, that would present a good buying opportunity. Swith to a much lower timeframe to do that, maybe 1 hr or 30 mins or even 15 mins.

    If however price breaks that upward trendline and CLOSED below it, look to go short(sell).

  22. Hello Traders and FTS4U fans,
    (1)12 new forex trading signals for the week 30th may -3rd June posted.
    (2) also updated the results of what happened this week 23rd-27th May 2016…only 2 setups formed, AUDNZD and GBPJPY. Audnzd moved 110 pips and GBPJPY moved 180 pips.

    Check them out.

    Don’t forget to share, tweet, like or link.
    Thanks

  23. Today is Friday (27th May) and its is one of the crazy days to trade from my experience (http://forextradingstrategies4u.com/best-days-of-the-week-to-trade-forex/) and if any of you have taken advantage of my forex trading signals for this week (24-27th forex trading signals) you should be now enjoying some really good profits on GBPJPY and AUDNZD trading setups that I mentioned.

    Are you going to take some profits off the table and leave some running, or move stop loss and lock in some profits and leave the trade running through the weekend or are you going to take all the profits off?
    Your choice!

    1. Hello RKay, your website is very informative. I am still new in trading and I am learning day by day. If it is possible can you share some of your trading signals.

      1. Hi Thulisile,
        thanks mate for visiting forextradingstrategies4u.com.

        Here’s one thing I’ve failed to notify you the traders about how the forex signals I send out work, so here it is:

        (1)I tend to send out weekly forex signals on a Saturday or Sunday (before the forex market opens on monday) you need to bookmark the forex signals page http://forextradingstrategies4u.com/forex-trading-signals/
        (2) At the worst case scenario, I will provide the free forex signals for the week just a few hours before the fx market opens on monday.
        (3) so keep checking that forex signals page and you’d be updated.
        (4) I know I should build an email list to notify all you traders when these free forex signals are released on the weekend but honestly speaking, SOMETIMES I JUST TO DAMN LAZY to do that.

        Cheers

Leave a Reply

This site uses Akismet to reduce spam. Learn how your comment data is processed.