Skip to content
Home » Forex Trading Weekly Setups Archive » Page 13

Forex Trading Weekly Setups Archive

Jan 5 – Jan 10 

How did we do?

AUDJPY – Pullback and strong looking reversal candlestick. About 120 pips from the four hour chart entry.

AUDUSD – Small bump of 20 pips off of lows on the four hour chart

CADJPY – Price continued to range

CHFJPY – Basing came after momentum upside thrust. Break out of highs for 70 pips potential

EURGPBP – Price range

EURNZD – Short lived pop down off a upthrust entry from four hour chart with 80 pips

GBPCHF – Price ranged

GBPJPY – Price ranged

GBPNZD – Thought of a short but nothing presented as entry

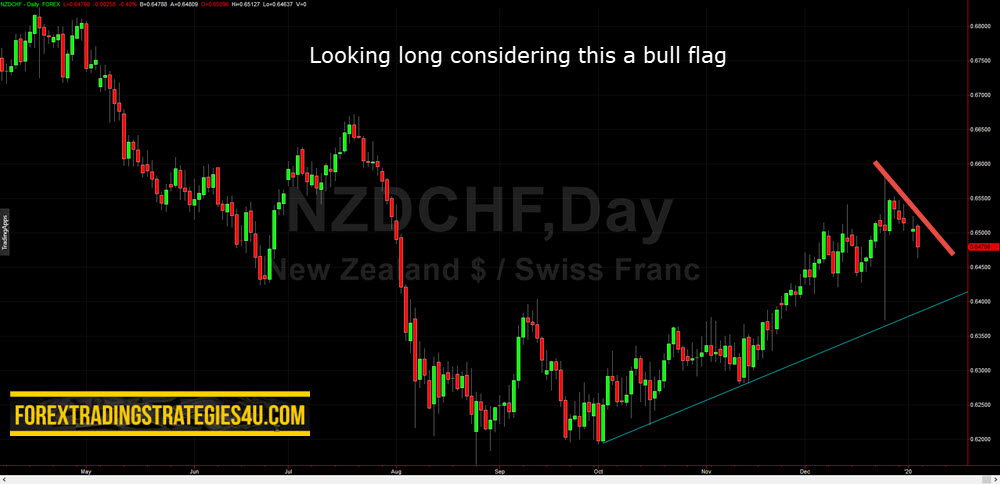
NZDCHF – Pullback occurred but no break of highs for entry

NZDUSD – Great pullback but no entry

USDJPY – Price came to highs at end of week.

The first week of 2020 is in the books with 579 pips potential using simple price structures, simple price patterns, and price action.
The price patterns we look for:
– flags (pullbacks)
– ranges (basing)
– failed tests of highs/lows
We look for price setups on the daily and will often use the four-hour charts for entries.
Entries are generally the same patterns but on a lower time frame.

AUDJPY
AUDJPY


AUDUSD
AUDUSD


CADJPY
CADJPY


CHFJPY
CHFJPY


EURGPBP
EURGPBP


EURNZD
EURNZD


GBPCHF
GBPCHF


GBPJPY
GBPJPY


GBPNZD
GBPNZD


NZDCHF
NZDCHF


NZDUSD
NZDUSD


USDJPY
USDJPY
Pages: 1 2 3 4 5 6 7 8 9 10 11 12 13 14 15 16 17 18 19 20 21 22 23

42 thoughts on “Forex Trading Weekly Setups Archive”

  1. Hi S.D,
    Wonderful blog, and contents. Thanks
    But, I have been having issues viewing weekly trade updates. I follow the link from my email, but the images or, and contents are blur. In fact, I havent been able to go through any weekly trade updates.

    How do I resolve this?

  2. Hey SD so I’ve been trying to figure out a routine and system that works for me for awhile now and I’m only focusing on a few select pairs before moving on to others and limiting myself to micro lots, i use daily and weekly key levels and daily levels to help me in my technical analysis I place all my trades on intra day based on what price is doing on the daily and weekly and I use other factors to help me to determine entry point swing highs swing lows, emas , support and resistance and a combination of other factors to decide my entry take profit and stops, even with all that going on it’s really hard to catch the big break outs cause where I am it happens at like 1 am and I’m asleep by the time I’ve tried the daily high low strategy and that never really seems to work out because they usually have a fake out before the real break out begins, is there something’s that I could be missing or some other areas I could look at to make my trading easier because I would like to figure out a way to determine if price will continue trending on daily charts and not having to fight myself to wake up at 1 am because I have a full time job but I’m trying make my way to full time trader .

    Sounds like you have a lot going on to determine setups. Any way you can simplify your approach? Does your approach have an edge? How do you know what a key level is? Why the need for so much supporting (possibly or not even relevant) variables? You can’t micromanage your entry price and frankly, a zone of price is more realistic.
    If you are getting faked out, my guess is your stop is too close. I use ATR stops. Generally 2X ATR. I don’t recall ever being faked out.

  3. SD, Love the analysis, how did you do on the EUR/AUD Short?

    Thanks. Keeping it simple. How did I do? This is not that type of site. I will occasionally post about a trade if there is a learning aspect to it but I am not into wagging.

  4. SD
    Just found your site, got to be one of the best PA sites and education out there – I will definitely spent some time here – i am tring to find an answer to my question of, what time frame are you showing for your analysis – when i look at the chart i cannot determine what TF your showing

    Thanks for the words. As mentioned in the preamble before the setup charts, these are daily price charts.

  5. Compliments of the season SD.- Last week’s EURUSD, in your feedback, you say there was 42 pips before price crashed. I think I missed the entry. Where was the entry?

    Right back at you. One day pullback on Jan 14. Drop to four hour chart, momentum off lows with basing at high of momentum. Enter in base when price breaks low of base and recovers.

  6. You are so kind and help many people. I m greatful with your instructions and explained very clearly. Most of people charge the free to teach but you don’t. I m glad to know your website
    I will recommend to all my friends
    Million thanks to you
    Dong from UK

  7. Whats going on with your blog? Have you sold your blog because the signals are ghosted and not delivered to my email anymore. Can’t get your signals on your website either. Is it a paid service now?

    1. Hey Gert. The emails are going out and it is ghosted but open when the email is entered. It is “cookied” so once you add your email, you should be able to access all the time. Paid? Never happen. This will always be free.

  8. Thanks for assisting traders, please what is the correct input to use for MACD and EMA crossing
    There is no correct setting for any indicator. There are many strategies using MACD and EMA on this blog.

  9. Hi Shane.
    Amazing blog – thanks for doing this. 🙂
    I have a question regarding this weeks setups. Am I right assuming several of your setups are daily failure tests of highs? Either after a strong move / or a failure test of a clear high on the chart? Or am I missing some context?
    Thanks.
    René
    You are not missing anything. That would then make them counter trend which generally means quicker taking profits. Keep in mind that as price evolves during the week, outlook on type of trade to take can change. The key is that every setup, even if price evolves into something else during the week, will use the exact trading techniques that are always used here. 🙂

  10. Hi SD, I hope I find you well. This week’s GBPJPY refers. What do we need to see on the chart in order to recognize price acceptance?
    Thanks in advance.
    Give me your thoughts

    1. Hi SD – Thanks for your response but I think you made an error because the CADJPY did not have a trendline. Please have a look again.
      No, I did not make an error. Yes, there is a trendline. You just have not defined what makes a trendline to you. You do you. I will do me. Thanks.

      1. SD – I meant when you sent the setup there was no trendline. So in such cases we can draw our own trendlines on the four hour so that we can get an entry.
        Thanks once again.
        Breaks of trendlines on lower time frames are triggers into a large time frame pattern (like how we can use a lower time frame range breakout to enter a higher timeframe pullback). They highlight a change of rhythm in the market. Sorry, I thought you said there was no trendline that could be drawn. 🙂

  11. Please,is it important to consider the weekly and monthly time frames when analysing?
    How would you consider them? What would you do differently? What information would you be looking for?

    1. When triangles break, they may pause but generally don’t retrace. If you fade momentum moves as a rule after triangles break, it is not a wise choice. Pent up energy in the market.

  12. SD – I hope I find you well. Last weeks setups did not have trend lines on the GBPUSD and GBPJPY and in your comments after the week you mention of trend line break. Was the lesson about us drawing our own trend lines? Because after the trend line breaks the setups did ok.

  13. GBP?JPY -Monday night, do you still believe I should go long now for another long upswing.
    Thanks much.
    I believe that you should take these setups and design your own approach to trading them. We are very careful to not give advice involving you or anybody else putting on risk.

  14. SD, I just found your site, I’m new to forex trading, and still learning and I have a few questions. Would there be a place I could contact you (by email for example), just to clear up a few simple questions I have.

    Thanks for this great resource btw, I’m learning a lot reading through it all.

    1. Nope. I like to use the four hour chart on trend line entries (remember that I don’t use trend lines for setups…breaks are a trigger) and support/resistance levels. I use daily a lot simply because I can afford the risk profiles. But no, use four hour for entries because you can see the imbalance of buyers and sellers better if you are not able to infer from the daily.

  15. S. D. This makes sense now. Last week I entered a trade on the EURGBP on the four hour chart. On the four hour chart it looked as if price had gone completely over the trend line and was just waiting for follow up and on the daily price had just gone a bit over the trend line. There was no follow up of price downwards and hence I lost the trade.

        1. I have written a few times that when you see price move from one extreme to another, like that momentum candlestick that wiped out 60 hours of previous trading gains, expect a reaction against the move. It’s no different than a market in a range and price running from resistance right through support….that is not a trade to take.

  16. S.D. Thanks for the commentary you add after every week. I still get confused as to when to use the four hour and the daily candles for entry. I don’t know how you can make it simpler for me to understand.

    1. No problem…..use the four hour chart side by side with the daily chart. Don’t look for setups on the four hour, just look for signs that the desired direction on the daily is setting up. Quick example….pullback trade on the daily chart. Drop to a four hour chart to see price resuming direction—a range breakout for example. How about a daily chart support holding or failing trading? Looking long, look for momentum or failure test of lows. Make sense?

Leave a Reply

This site uses Akismet to reduce spam. Learn how your comment data is processed.