Mar 27 – April 1
Results
BTCUSD – $3000 jump on the bullish setup in Bitcoin. Price retraced back to the breakout zone.
ETHUSD – Price rose $330 from the from the brief consolidation, broke resistance on a less than healthy break
EURCHF – Rally off of the support line for 146 pips before retracing back to support
EURJPY – Price rallied off the consolidation at resistance for 280 pips before putting in the retrace. Think of this in terms of a failed breakout.
GBPJPY – Good example of an exhaustion to the upside with the long upper shadow. These set up reversals and this one ran 183 pips before consolidating.
NZDUSD – Price broke down and while it rallied back up to the consolidation zone, there is no trade
USDCHF – Price put in a short lived upside move off the reversal candles at support. 67 pips.
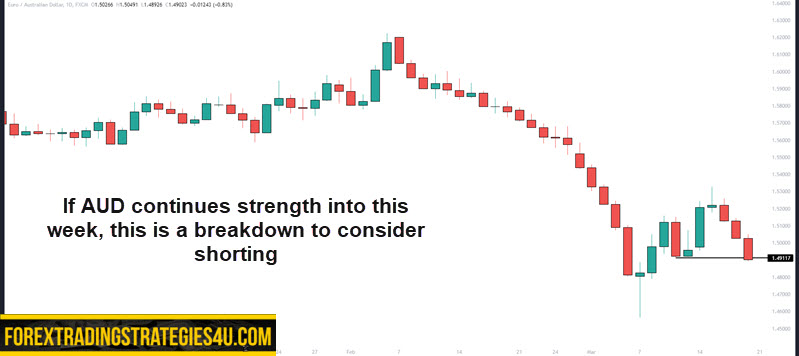
424 pips potential last week on only four set ups with the EURAUD with the bulk of the gain.
Keep in mind that in Forex, the amount of pips is only relevant when attaching a dollar amount. For some, 424 would be $400. For others, it could be in the thousands and for some, a couple of bucks.
The point is you don’t need hundreds of pips to make money in FX. What’s more important is a positive edge and an account size the allows larger positions with good risk protocols.
A lot of currencies are extended and not setting up for a counter trend trade. If you take those, just take profits when you see weakness setting in.
Mar 20 – Mar 25
Results
EURAUD – Price continued lower and our lower time frame four hour chart gave us the entry on a pullback and breakdown. 286 pips to lows
EURCHF – Another break down and the four hour chart gave us a pullback to enter on breakdown of lows. 69 pips to lows potential
EURUSD – Price ranged
GBPCAD – Small pop off inside bar which is a lower time frame consolidation. 69 pips upside before breaking down.
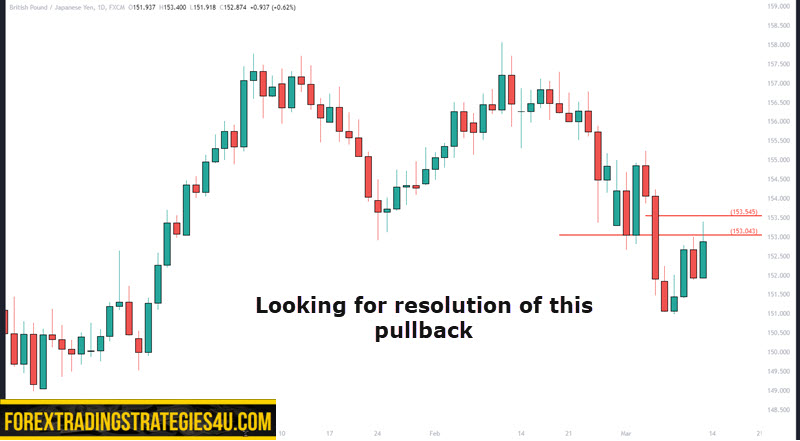
Almost 750 pips potential last week with the big move in EURJPY offering no entry. For this week, not a lot of Forex pairs set up in structure we can trade. Some pullbacks are too far extended to enter. Pay attention to the EURUSD for a good structure trading lesson. It may not work out but higher lows into resistance is, over the long term, more bullish than it is bearish.
Mar 13 – Mar 18
Results
AUDUSD – Price broke downward completing a complex correction and put in a lower time frame consolidation. This was a breakout entry into a pullback reversal. 190 pips upside. Lesson: When you see the end of an impulse move that has a long upper shadow for an uptrend, I generally expect a complex correction over a simple correction.
EURAUD – Price continued a pullback and set up an obvious reversal candle right at the prior support of October 2021 which now acted as resistance. 285 pips potential.
EURCHF – Price broke to the upside.
EURJPY – Price ripped to the upside and didn’t get any entry for a long.
GBPJPY – No breakdown and using the four hour chart on March 15, lower time frame PB for 273 pip upside. The key to going long was the push into lows, as shown by the consolidation after momentum, did set up a reversal. The slight consolidation on the impulse leg after the momentum off the lows, gave insight into a long.
NZDUSD – Price broke down but was a push from the high of the range. These usually set up a reversal back into the direction of the range. Skip these types of breakouts.
USDCAD – No trade
485 pips with last weeks setups. Some good lessons with AUDUSD and EURGBP. When trading pullbacks, we don’t want to see momentum come into the corrective move. Momentum moves generally have traders jumping in for another move in the same direction. Looking for consolidation and then trading that break in your direction is a safer play. GBPCAD is a good example of reading price action. While some may think it’s a reversal candle, it was really a consolidation because it closed in the middle of the range. Learning to infer lower time frame price action through higher time frame candles, is a worth skill to learn.
Mar 6 – Mar 11
Results
AUDUSD – We had a 2 candle pullback with the first candle being an exhaustion candle. No trade as not enough consolidation
EURGBP – We had the pullback to our red zone but far too much momentum in the correction to short
EURJPY – Called the snap back and a four hour chart entry with a buy stop over the March 6 candle led to a 344 pip jump in price.
GBPAUD – Reversal candlestick plotted and entry was at March 6 high. Price rallied and pulled back putting in a lower swing high on March 7. Buy stop lowered and price led to 120 pips upside.
GBPCAD – Reversal candle closed in middle of range which is not a true reversal. Pullback was not deep enough but this was a good short but no proper setup.
GBPUSD – Would have loved this short but price was extended coming into the week and continued to drop. No entry.
NZUDUSD – Failure test showed up for 21 pip drop but price continued to range after that.
404 pips potential this past week along with some short lived moves in Crypto.
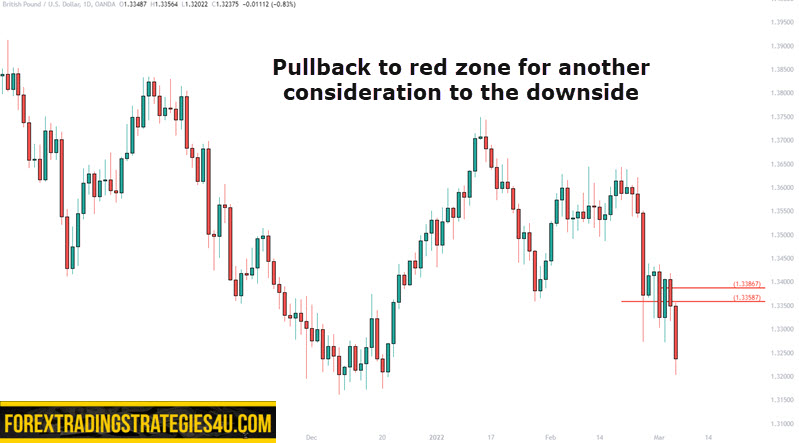
Many of the major FX pairs have had some large moves this past week. Those are tough to trade as overextended price has a strong tendency to snap back at any moment. If you do trade against the main move, look for close profit targets. Don’t be greedy. FX does not have the same drivers as other instruments. Geopolitical issues and monetary policy are the biggest drivers. With the current conflict, you can see currencies being affected.
As for crypto, the current price conditions are not simple to trade. I’d like to see some type of strong move before looking for an entry.
The issue is, with many markets in general, strong moves are being reversed. I am trading my plan and taking 1.2R targets for the most part. Better days are ahead.
Feb 27 – Mar 4
BTCUSD – Short lived move off a break of our entry zone. $4300 jump and collapse.
ETHUSD – No entry as price seems to be forming a triangle
GBPCAD – Price was holding support on the daily. The Feb 28 candle showed a lower time frame rally and collapse. This put a short in play for 154 pips. Learning how to read lower time frame price action through the individual higher time frame candles, can be a strong edge for a trader.
GBPUSD – Inside bar break to the downside for 160
NZDUSD – Long setup was good for 90 pips as price followed through the black line
SOLUSD – Short lived upside for $11
USDJPY – Price ranged
One look at the major and a few minor FX pairs shows some price action in pretty rough shape. Not much in the way of trending price action out of the 16 pairs I look through for setups. The best trade of last week was GBPNZD and the resolution of a triangle pattern but still 420 pips potential. Triangles, when they break, can move quite a distance before finding a pause and is one pattern your should look for.
Thanks for the setups.
BTCUSD has a bear flag that got broken last week. My final target is 12k.
Certainly not a far fetched outcome for Bitcoin. While I don’t usually make projections, 12-17K is doable.
Watch out for inverse H&S on GBPAUD. This pair may be reversing here.
Signals 16-21 January, please explain the following:
AUDJPY on the monthly timeframe is in downtrend, making lower highs. On the weekly timeframe, it makes double top. On the daily timeframe, if you draw a trendline joining the lows of 3 December, 20 December and 10 January, it has just break the trendline. What are your criteria to look for upside?
I submit that the monthly has been moving higher off the lows of March 2020 and is putting in higher highs and lows with over a 2000 pip run. I also submit that the monthly is a range at highs.
I don’t consider monthly outside of structures…such as the consolidation.
The weekly double top has done it’s job. I’d have been more impressed with the double top if there was an actual momentum break of highs and immediate rejection. If that had occurred, we may have seen a true down trend form. I see more the weekly forming a triangle.
If I were a weekly chart trader, I would have shorted the recent rally due to the strong move to the downside.
Daily. My trendlines rules don’t just connect any high or low. I have to be able to connect the last low into a high for a valid uptrend line. Your trend line, for me, is not valid.
Because your trend line is not valid for me, this recent move was, at first, the making of a complex correction. However, once price started basing on support, that is bearish. The momentum move down on the last day of the week, confirmed the break.
I am a swing trader. While I take the trend into consideration, I have other price action and structures I concern myself with. I know my time frame. I can easily trade a bull flag on a daily during a down trend on the weekly. It’s paid off extremely well over the years not only in FX and Crypto, but also stocks. I don’t trade futures much anymore.
How is audjpy in a downtrend on Monthly. It is a clear uptrend having broken all kinds of previous highs.
EURGBP longs will not be ready until the price takes out the Double Bottom it established in 2020. Once that is done, it will be a great trade for the year, all the way to 0.90
I see where you are going with that. Take out the potential support, reverse, and look to trap shorts who must reverse. What you trade in time frame dependent. Most certainly as a swing trader there were clear opportunities to buy. Keep in mind the currencies are driven by different factors that have a greater effect on sustained price moves than standard technical analysis.
Well, as I had pointed out eurgbp did take out that DB. But euro is still very weak bcos of the war. I will wait until the war situation cools down and then look for setups in euro to buy
Yes. One look at the Euro futures and it’s easy to see how weak the Euro is.
By the same token, the Yen futures is also weak.
Depending on your time horizon, playing long in a EUR cross can work.
Traders just have to ensure they have a trade manage plan or they can get eaten up.
Is basing at highs or lows essentially a flag pattern, traded in the usual manner? Fantastic content all round, thank you for your efforts!
Appreciate it Ben.
Basing would generally mean a horizontal range but they take many forms. Patterns are rarely perfect and I find the uglier it is, the better it can trade.
The basing can have you enter a position before breaks that will lure in other traders. Failure test of the lows of the base, a break of a previous candle high, can be entries. I also don’t look for a perfect entry location. As long as I have direction right and use smart stops, I don’t have to pick the top or bottom.
That said, basing, flags, etc, I will generally call all of them a consolidation for simplicity sake.
Hi. For wk 10th Oct, you mentioned that you traded inside bar set ups for CAD/JPY and CHF/JPY for very good pip gains. I’m learning so would really appreciate it if you could confirm the date and timeframe, which these occurred please.
I don’t have the time to go back over old charts however any time frame entry other than the daily, will be the four hour chart. Inside bars are obvious.
Keep in mind that all you have with an inside bar, is a lower time frame consolidation. You can play the break of the inside bar OR head to a lower time frame to see the consolidation.
Hi SD,
I just discovered this website. Do you typically send out alerts of when you enter these given trades?
Thanks for coming by. The only time I update is on the weekend. Every trader will have their own way of triggering into the trades. As you go through the history of this section, you will read about the few triggers that are used. This was never about having a trade alert service.
Thank you so much i find it promising since
It provides the signals with educational touches.
So clever idea and productive
Keep it up you deserve all support
Thanks for all the information you provide.
I started trading in May this year. Am only on a demo account for the time being. I have learnt alot from Youtube etc and think that I have a gresp of the basics.
I started off alright but now I am making the wrong decisions, and am finding it increasingly difficult to read the charts. It’s all becoming a nightmare.
Any advice would be most welcome.
Thanks so much ❤️❤️📈📈
This is absolutely wonderful
Hi SD.. I’m Bkay, thank you so much for the information you share with us new traders, highly appreciated…I was wondering as a price action trader, what timeframes do I have to use to check for reversal candlestick patterns?
Thanks for the words. All timeframes are important depending on your style. For me, daily charts, four hour charts, and a bigger picture weekly/monthly are used.
Thanks.
@SD
Many thanks for replying and I would just like to add that for someone who is 53 years old…..starting out all over again I wanted to say thankyou for the amount of information you have provided for the likes of me who are just starting out.
Good luck to you and all that follow your trade setups as for me I am going to be practicing until I know, understand the tools I will be using (including charting software), and develop my edge as a PA trader.
Best
Hey Jay. You are welcome. Take your time, understand why I choose these setups and the trade triggers.
Is there a way that the charts with recommendations can be enlarged or blown larger so that the level numbers are visible clearly. Thank you. Mohann
You don’t need the exact price point. Just find the location on the chart and draw a box. You used to be able to click on the image and get the larger….but a few sites were using my images on their sites. I disabled that function.
Thank you for your analysis.
Hi SD,
I have been following your trade set ups. To be honest, I like your approach which has taught me alot in this market. Great work
Glad to read that John. What’s great about the setups I pick and the trade triggers on the lower time frames, there’s usually a trade that works (even a little) or a trade that never triggers. Really helps win loss rate which, although not the only measure of success, it’s a good starting point.
Hi SD,
I hope I find you well.
I can now easily find the triggers and trade successfully.
Now, I want to spot the setups for the coming week on my own and compare what I have with yours.
Can you tell me what should I look for or how should I go about it.
Your help in this regard will be much appreciated.
Hey Shingi. Glad to see that finding the triggers has become easier. You probably have about 3 you can use on the lower time frame trigger chart – trend line breaks, breakouts, failed tests of lows/highs. If you go back over all he setup charts, you will start to see a theme as to why I pick the ones that I do. Much better way to “get it” as opposed to me explaining it
Really nice content. I’m learning a lot on how to get in to the markets at the right levels. Cheers.
Great setup
Hi SD, do you have a social media platform where you traders signals so I that I can know exactly when to take a trade. Thanks
And great work, you’re the best at what you do
Hey David. Thanks for the words. No, I don’t use social media. Weird, I know! Your goal should be to find trade triggers that work for you. So many ways to do that – indicator, reversal candle, breakouts on lower time frames, trend line breaks……..
Hi SD, I took a 2/1 profit on NZDJPY thanks for that and look forward to the coming weeks setups
Great work Oliver.
Please,I need some of the indicators that you mentioned in ur scalping trading strategy.
(1)Fisher Indicator
(2)supertrendTrend Indicator.
kindly help on how to get them.Because it’s not in the indicators list on my MT4 platform.
You are going to have to search for them. I don’t use MT4 but I am sure they are coded somewhere. Google, can be your friend: https://www.best-metatrader-indicators.com/super-trend/
Hi, I’m a newbie. Which charting software do you use or would recommend
I use Tradingview for all my charts. There is a free version but since I trade stocks and futures as well, I use the pro plan and data add-ons.
Hi SD – Happy New year!!
How did last week’s setups do?
https://forextradingstrategies4u.com/forex-trading-signals-5/
Great setups
Comments are closed.