April 18 – April 23 2021 – RESULTS UPDATED
AUDCAD – Price pulled into our zone late week. Four hour chart inside bar break to the upside for 42 pips potential before falling back
AUDUSD – Price ranged
EURCAD – We didn’t see a deep enough pullback on this pair
GBPAUD – We gout our rally and shorting on the four hour trend line break lead to 87 pips to the downside
GBPCAD – Break above and price hovering at 1.7324 is basing under the main resistance of 1.7334. Entering the in base (we’ve covered this many times) gets you involved before the break. 252 pips to the upside.
GBPUSD – Never got the entry before the move up due to lack of pullback
NZDCAD – Missed the trend line break entry on the four hour with the momentum push. Price paused just before a break out entry of highs. 98 pips to upside.
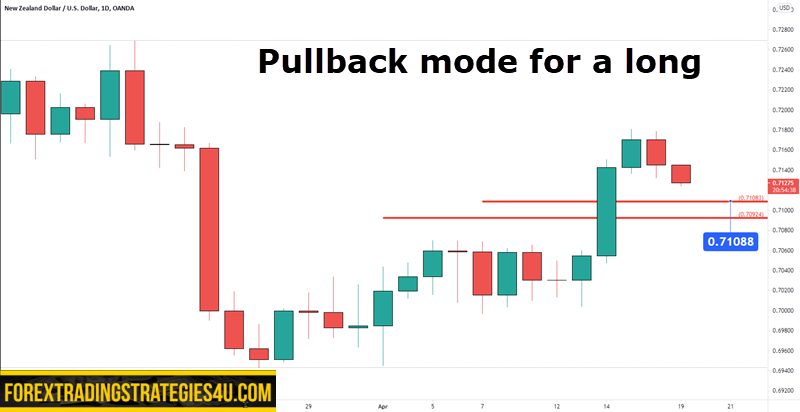
NZDUSD – Price ranged
A ton of ranging price action last week only brought in potential 159 pips. Even this week, price action and current structures just aren’t “flying off the chart” types of setups. These types of pauses are normal and if you are a new trader, don’t try to make something happen.
Experienced traders can head to lower time frames as these setups unfold. Looking at an hourly chart as an example may allow you to get some trades off using the setups as the basis for your trade.
New feature on the charts are the price boxes. These are ZONES….and not specific price points for reversals (although we’ve had many through the years that reversed, to the pip, from our red levels.


April 11 – April 16 2021 – UPDATED
How did these do?
EURCHF – Price did rally right back into the range which does not disqualify the setup. However, too much momentum in the rally to consider a short.
EURJPY – Price just ranged
GBPCHF – Price ranged
GBPJPY – Price ranged
GBPNZD – Failure test of lows in four hour chart range. Buy stop highs for 159 upside.
One thing about using a four hour chart entry on a daily setup is there are times where price moves fast. On the EURJPY, we had momentum off our zone but only manage 29 pips. While it is tempting to go to an hourly chart or lower for an earlier entry, sticking to your rules is always the best course of action.
Overall, 480 pips potential this past week. Some setups failed into ranges and others saw momentum step in that invalidated the setup.


April 4 – April 9 2021 – UPDATED
How did these do?
CADCHF – Price dumped 143 pips from the four hour chart entry. Momentum push down April 5,, lazy pullback and play break of trendline that setups up with the trendline.
EURCAD – Price rallied into our zone and four hour reversal candlestick lead to 89 pips to lows.
EURJPY – Price came into our zone and momentum push off lows. Only 29 pips with entry after bullish momentum push.
EURUSD – Price came into our zone and ranged.
GBPAUD – Price collapsed with momentum taking longs off the table.
GBPUSD – Price pulled into my zone. On the four hour chart, a range formed giving a trade entry on the breakout to the downside. In essence, using a lower time frame breakout to enter into a higher time frame pullback. 219 pips to lows
USDCHF – Was looking for weakness on a pullback but got momentum instead. No trade.
372 pips potential last week and AUDCAD gave a good lesson on tight stops. My “goto” stop placement is usually 2X average true range. This is a volatility stop loss that takes into account current market conditions. Using pivots of highs and lows disregards the presence of outside bars which will stop you out and then head into the other direction.
7 setups this week. I am finding quite a few pairs are trading inside past weeks and last month. That can lead to choppy trading conditions so I ignored them even if the daily chart was looking like it could set up.


