Aug 15 – Aug 20 2021 – Results Updated
AUDCHF – Late to the party as there was no entry until price ranged on the four hour chart. 160 pips to lows.
BTCUSD – Bitcoin gave the entry and began to pull back. Since we are looking simply for decent entries for positions, it’s hold. Price eventually rewarded with a $2000 move.
EURAUD – Massive move on the break of the entry line for a 399 pip moves to high
EURUSD – No trigger
GBPCHF – 211 pips from break of entry line
GBPUSD – Price melted down
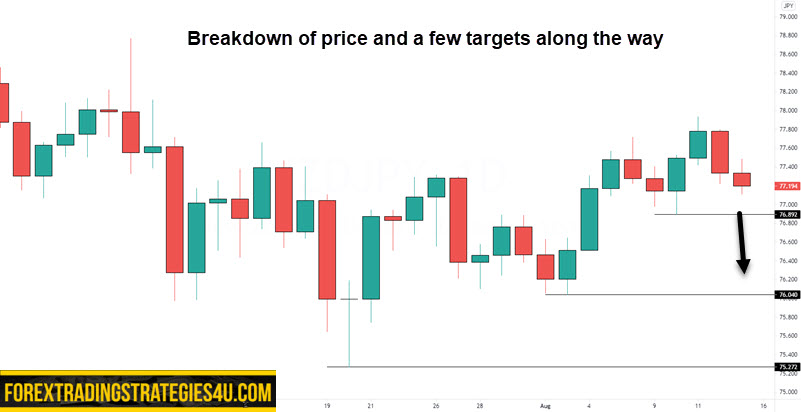
NZDJPY – All targets hit on the breakdown for 162 pips
USDCHF – Lackluster break with 51 pips to lows before price fired back to the upside
USDJPY – 43 pips from break to lows and then price rallied.
289 pips from last week. Those were mostly continuation plays on the daily but using the lower time frames for the reversal trigger. This week, a few better setups including a few entry points on Bitcoin. Again, continuation trades are better traded off the four hour chart looking for a reversal, range breakout, or any type of trigger that puts price in the direction you want to trade.
Aug 8 – Aug 13 2021
249 pips this past week as price movement is quite slow. Without strong directional movement, it can be tough to manage trades. This is why trade management is just as important as where to enter and exit.
This week we see a long of currency pairs consolidating on higher time frames. This makes for choppy trading conditions on the lower daily charts. Still, we have 7 lined up for the coming week as we look for some continuation moves in most of them.
Aug 1 – Aug 6 2021 – Results Updated
AUDJPY – Price did not break our entry level
CADCHF – Price broke down and dropped 67 pips to lows.
CHFJPY – Price could not advance for a long trade
EURCAD – Price broke up with 57 pips run before falling back
EURJPY – Price ranged between our marked high and low point
GBPCAD – Pullback played out for 125 pips to highs
GBPCHF – Price did not break our entry line.
Pretty happy with the Forex charts from last week seeing potential pips of 759. Can’t forget the good entry on Bitcoin that saw a gain of $5000.
As usual, when you have one good week, the next week doesn’t look as great. Still some good setups with some being continuation trade setups. While reversals can get you a better entry, some times price is already on the move. Those are continuation trades. You can use a lower time frame, lower than the standard 4 hour chart, to see if you can find consolidations to trade off of in the direction of the higher time frame.
July 25 – July 30 – Results Updated
AUDCAD – Price broke through daily trend line being used to trigger trade for 88 pips
AUDJPY – Four hour trend line break had 44 pips downside. Price did rally for another short but price had yet to make lower lows. We considered it to be a trading range.
AUDUSD – Price ranged
BTCUSD – Price hit entry trigger of 36623.79 which was the swing high and broke. Price rallied $5700
CADJPY – Looking long as per chart. Outside bar entry at lows for a 103 pip upside run.
EURAUD – Break of reversal candle high sent price 178 pips upside
GBPCHF – Price put in a higher swing low on the four hour chart and trading range was considered. Price rallied to backside of trend line, put in lower high and had room to travel before running into support. Enter on reversal candle and price tumbled 90 pips
GBPJPY – Price did as expected and breakout pullback on the four hour chart entry led to 90 pips to highs.
GBPUSD – Price continued higher. No short.
NZDCAD – Price broke down on four hour chart trend line break for 66 pips to lows
NZDCHF – Price broke down and four hour chart trigger on trend line break for 100 pips to lows.
611 potential pips last week even with conflicted price structure. Some Forex pairs held ranges while others tested swing highs/lows and then failed.
This week we have Bitcoin back in the mix as we are starting to see life. A few hurdles to cross before we can really get moving and we are looking to take advantage of those breaks.
Thanks for the setups.
BTCUSD has a bear flag that got broken last week. My final target is 12k.
Certainly not a far fetched outcome for Bitcoin. While I don’t usually make projections, 12-17K is doable.
Watch out for inverse H&S on GBPAUD. This pair may be reversing here.
Signals 16-21 January, please explain the following:
AUDJPY on the monthly timeframe is in downtrend, making lower highs. On the weekly timeframe, it makes double top. On the daily timeframe, if you draw a trendline joining the lows of 3 December, 20 December and 10 January, it has just break the trendline. What are your criteria to look for upside?
I submit that the monthly has been moving higher off the lows of March 2020 and is putting in higher highs and lows with over a 2000 pip run. I also submit that the monthly is a range at highs.
I don’t consider monthly outside of structures…such as the consolidation.
The weekly double top has done it’s job. I’d have been more impressed with the double top if there was an actual momentum break of highs and immediate rejection. If that had occurred, we may have seen a true down trend form. I see more the weekly forming a triangle.
If I were a weekly chart trader, I would have shorted the recent rally due to the strong move to the downside.
Daily. My trendlines rules don’t just connect any high or low. I have to be able to connect the last low into a high for a valid uptrend line. Your trend line, for me, is not valid.
Because your trend line is not valid for me, this recent move was, at first, the making of a complex correction. However, once price started basing on support, that is bearish. The momentum move down on the last day of the week, confirmed the break.
I am a swing trader. While I take the trend into consideration, I have other price action and structures I concern myself with. I know my time frame. I can easily trade a bull flag on a daily during a down trend on the weekly. It’s paid off extremely well over the years not only in FX and Crypto, but also stocks. I don’t trade futures much anymore.
How is audjpy in a downtrend on Monthly. It is a clear uptrend having broken all kinds of previous highs.
EURGBP longs will not be ready until the price takes out the Double Bottom it established in 2020. Once that is done, it will be a great trade for the year, all the way to 0.90
I see where you are going with that. Take out the potential support, reverse, and look to trap shorts who must reverse. What you trade in time frame dependent. Most certainly as a swing trader there were clear opportunities to buy. Keep in mind the currencies are driven by different factors that have a greater effect on sustained price moves than standard technical analysis.
Well, as I had pointed out eurgbp did take out that DB. But euro is still very weak bcos of the war. I will wait until the war situation cools down and then look for setups in euro to buy
Yes. One look at the Euro futures and it’s easy to see how weak the Euro is.
By the same token, the Yen futures is also weak.
Depending on your time horizon, playing long in a EUR cross can work.
Traders just have to ensure they have a trade manage plan or they can get eaten up.
Is basing at highs or lows essentially a flag pattern, traded in the usual manner? Fantastic content all round, thank you for your efforts!
Appreciate it Ben.
Basing would generally mean a horizontal range but they take many forms. Patterns are rarely perfect and I find the uglier it is, the better it can trade.
The basing can have you enter a position before breaks that will lure in other traders. Failure test of the lows of the base, a break of a previous candle high, can be entries. I also don’t look for a perfect entry location. As long as I have direction right and use smart stops, I don’t have to pick the top or bottom.
That said, basing, flags, etc, I will generally call all of them a consolidation for simplicity sake.
Hi. For wk 10th Oct, you mentioned that you traded inside bar set ups for CAD/JPY and CHF/JPY for very good pip gains. I’m learning so would really appreciate it if you could confirm the date and timeframe, which these occurred please.
I don’t have the time to go back over old charts however any time frame entry other than the daily, will be the four hour chart. Inside bars are obvious.
Keep in mind that all you have with an inside bar, is a lower time frame consolidation. You can play the break of the inside bar OR head to a lower time frame to see the consolidation.
Hi SD,
I just discovered this website. Do you typically send out alerts of when you enter these given trades?
Thanks for coming by. The only time I update is on the weekend. Every trader will have their own way of triggering into the trades. As you go through the history of this section, you will read about the few triggers that are used. This was never about having a trade alert service.
Thank you so much i find it promising since
It provides the signals with educational touches.
So clever idea and productive
Keep it up you deserve all support
Thanks for all the information you provide.
I started trading in May this year. Am only on a demo account for the time being. I have learnt alot from Youtube etc and think that I have a gresp of the basics.
I started off alright but now I am making the wrong decisions, and am finding it increasingly difficult to read the charts. It’s all becoming a nightmare.
Any advice would be most welcome.
Thanks so much ❤️❤️📈📈
This is absolutely wonderful
Hi SD.. I’m Bkay, thank you so much for the information you share with us new traders, highly appreciated…I was wondering as a price action trader, what timeframes do I have to use to check for reversal candlestick patterns?
Thanks for the words. All timeframes are important depending on your style. For me, daily charts, four hour charts, and a bigger picture weekly/monthly are used.
Thanks.
@SD
Many thanks for replying and I would just like to add that for someone who is 53 years old…..starting out all over again I wanted to say thankyou for the amount of information you have provided for the likes of me who are just starting out.
Good luck to you and all that follow your trade setups as for me I am going to be practicing until I know, understand the tools I will be using (including charting software), and develop my edge as a PA trader.
Best
Hey Jay. You are welcome. Take your time, understand why I choose these setups and the trade triggers.
Is there a way that the charts with recommendations can be enlarged or blown larger so that the level numbers are visible clearly. Thank you. Mohann
You don’t need the exact price point. Just find the location on the chart and draw a box. You used to be able to click on the image and get the larger….but a few sites were using my images on their sites. I disabled that function.
Thank you for your analysis.
Hi SD,
I have been following your trade set ups. To be honest, I like your approach which has taught me alot in this market. Great work
Glad to read that John. What’s great about the setups I pick and the trade triggers on the lower time frames, there’s usually a trade that works (even a little) or a trade that never triggers. Really helps win loss rate which, although not the only measure of success, it’s a good starting point.
Hi SD,
I hope I find you well.
I can now easily find the triggers and trade successfully.
Now, I want to spot the setups for the coming week on my own and compare what I have with yours.
Can you tell me what should I look for or how should I go about it.
Your help in this regard will be much appreciated.
Hey Shingi. Glad to see that finding the triggers has become easier. You probably have about 3 you can use on the lower time frame trigger chart – trend line breaks, breakouts, failed tests of lows/highs. If you go back over all he setup charts, you will start to see a theme as to why I pick the ones that I do. Much better way to “get it” as opposed to me explaining it
Really nice content. I’m learning a lot on how to get in to the markets at the right levels. Cheers.
Great setup
Hi SD, do you have a social media platform where you traders signals so I that I can know exactly when to take a trade. Thanks
And great work, you’re the best at what you do
Hey David. Thanks for the words. No, I don’t use social media. Weird, I know! Your goal should be to find trade triggers that work for you. So many ways to do that – indicator, reversal candle, breakouts on lower time frames, trend line breaks……..
Hi SD, I took a 2/1 profit on NZDJPY thanks for that and look forward to the coming weeks setups
Great work Oliver.
Please,I need some of the indicators that you mentioned in ur scalping trading strategy.
(1)Fisher Indicator
(2)supertrendTrend Indicator.
kindly help on how to get them.Because it’s not in the indicators list on my MT4 platform.
You are going to have to search for them. I don’t use MT4 but I am sure they are coded somewhere. Google, can be your friend: https://www.best-metatrader-indicators.com/super-trend/
Hi, I’m a newbie. Which charting software do you use or would recommend
I use Tradingview for all my charts. There is a free version but since I trade stocks and futures as well, I use the pro plan and data add-ons.
Hi SD – Happy New year!!
How did last week’s setups do?
https://forextradingstrategies4u.com/forex-trading-signals-5/
Great setups
Comments are closed.